Physical Address
304 North Cardinal St.
Dorchester Center, MA 02124
Physical Address
304 North Cardinal St.
Dorchester Center, MA 02124

Liberalizing Cities
From The Ground Up
In Escaping the Housing Trap, Charles Marohn and Daniel Herriges address the role of zoning in creating the housing crisis. Like some other recent books (most notably by Nolan Gray and Bryan Caplan) this book shows how zoning limits housing supply and thus has led to our current housing crisis. But unlike Gray and Caplan, Marohn and Herriges focus on modest, politically feasible reforms rather than on the benefits of total deregulation. Like other authors, Marohn and Herriges discuss the history of downzoning. For example, in Somerville, Mass., a middle-class suburb of Boston with 80,000 residents, only 22 houses conform to the city’s own zoning code. And in San Francisco, 54 percent of homes are in buildings that could not legally be built today. In Manhattan, 40 percent of buildings are nonconforming. Why? Because zoning has become steadily more restrictive over time, making new housing difficult to build. Where development occurs, it is in a tiny fraction of the region’s neighborhoods- usually, either at the outermost fringe of suburbia or in a few dense urban neighborhoods. For example, in Hennepin County, Minnesota (Minneapolis and its inner suburbs) 75 percent of all housing units built between 2014 and 2019 were in 11 percent of the county’s neighborhoods. In Cuyahoga County, Ohio (Cleveland and its inner suburbs) 75 percent of housing units were built in under 5 percent of the county’s neighborhoods. Marohn and Herriges also critique some anti-housing arguments. For example, one common argument is that only public housing is useful, because the very poor will never be served by the market. They correctly respond that even if there will always be some people in need of government assistance, adequate housing supply will reduce that number. They write that housing policy “will look very different in a situation where the market […]

NYU professor Arpit Gupta has channeled the annoyance of economists into a blog post directly calling out the Strong Towns "growth Ponzi scheme" line of argument.

A 2017 increase in allowed floor area ratio in Mumbai had a tremendous impact on affordability by accidentally improving the economics of smaller apartments.
Last year disappointed pro-housing advocates in Colorado, as Governor Polis’s flagship reform was defeated by the state legislature. But Polis and his legislative allies tried again this year, and yesterday the governor signed into law a package of reforms which cover much of the ground of last year’s ill-fated HB23-213. HB24-1152 is an ADU bill. It applies to cities with populations over 1000 within metropolitan planning areas (so, the Front Range – home to most of Colorado’s major cities – along with Grand Junction), and CDPs with populations over 10,000 within MPOs. Within those jurisdictions, the law requires the permitting of at least 1 ADU per lot in any zone that permits single-family homes, without public hearings, parking requirements, owner-occupancy requirements, or ‘restrictive’ design or dimensional standards. The law also appropriates funds available for ADU permit fee mitigation, to be made available to ADU-supportive jurisdictions which go beyond compliance with the law to make ADUs easier to build (including jurisdictions not subject to the law’s preemption provisions). HB24-1304 eliminates parking minimums for multifamily and mixed-use buildings near transit within MPOs (though localities can impose parking minimums up to 1 space per unit for buildings of 20+ units or for buildings with affordable housing, if they issue a fact-based finding showing negative impacts otherwise). This bill was pared down in the Senate and would originally have eliminated parking requirements within MPOs entirely. HB24-1313 is a TOD and planning obligations bill. The bill:– Designates certain localities as ‘transit-oriented’ (if they are within MPOs, have a population of 4,000+, and have 75+ acres total either within ¼ mile of a frequent transit route or within ½ mile of a transit station – in effect, 30 or so localities along the Front Range).– Assigns all transit-oriented communities (TOCs) housing opportunity goals, which are simply […]

How do urbanists respond to a disaster? Emails from Brazil's Rodrigo Rocha show innovation and personal resilience in the face of crisis.
Two law professors, Joshua Braver of Wisconsin and Ilya Somin of George Mason, are coming out with an article suggesting that exclusionary zoning (by which they mean, rules such as apartment bans and minimum lot sizes that are designed to exclude people less affluent than an area’s current residents) violate the Takings Clause of the U.S. Constitution. Rather than focusing solely on originalist interpretations of the clause and on policy-oriented “living Constitution” theories, the authors rely on both theories. Under a living Constitution view, they argue that zoning unfairly disfavors vulnerable minorities (anyone who cannot afford to live in a place under current zoning), unfairly limit individual autonomy by limiting the right to move to a new neighborhood, and creates an oligarchy of elite homeowners. From an originalist perspective, the authors argue that the Takings Clause was intended to protect “a right to use [property], not merely a right against physical seizure by the state.” The authors admit that this right is not absolute, but is limited by the police power of the state. However, the authors cite some early treatises suggesting that the police power is limited to truly dangerous activities, as opposed to merely unpopular land uses such as apartments.

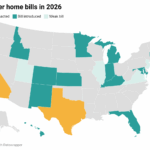
Check out my new post at Metropolitan Abundance Project: How “inclusionary” are market-rate rentals? In metropolitan Baltimore, a family of four making $73,000 in 2024 qualifies for 60% AMI affordable housing, where it would pay $1,825 per month for rent, utilities included. A third of new market-rate three-bedroom units in Baltimore are rented at around that level.Baltimore is typical, as it turns out. In most U.S. metro areas, a substantial share of rentals constructed since 2010 were, in 2021 and 2022, affordable at 60% of AMI… You can also check out maps showing rentals affordable at 80% and 120% of AMI. The ACS data don’t let me distinguish market-rate from subsidized rentals, so these include LIHTC and other subsidized rentals. Those, however, can’t explain away the core result, and the data don’t show the bifurcated market that some people imagine, with a huge gap between market and deed-restricted rents.

Research shows that the implementation of an eviction moratorium significantly disadvantaged African Americans in the housing search process.
As anticipated by the “radical agreement” among the parties and justices at oral argument, the Supreme Court’s recently released decision in Sheetz v. County of El Dorado put to rest the question of whether legislatively-imposed land use permit conditions are outside the scope of the takings clause. The unanimous ruling confirms the common-sense proposition that a state action cannot evade constitutional scrutiny simply because it’s a law of general application rather than an administrative decree, and subjects conditions on building permits – whether monetary or not – to the essential nexus and rough proportionality requirements enshrined in the Nollan and Dolan cases. The narrow ruling reflects the sound principle that, when dealing with constitutional questions, a court shouldn’t address hypotheticals or other issues not in direct contention among the parties. Nonetheless, the majority felt compelled to state that it would not address “whether a permit condition imposed on a class of properties must be tailored with the same degree of specificity as a permit condition that targets a particular development,” which seems to leave open the possibility that the answer might be “no.” Justice Gorsuch, in his concurrence, was astonished by this statement, wondering how a court which had just endorsed the universal applicability of the takings clause could stumble into another arbitrary distinction with no basis in common sense or constitutional law. The court’s concern was not a jurisprudential one, but apparently a policy one: in another concurrence, Justices Kavanaugh, Kagan and Jackson note that “[i]mportantly, therefore, today’s decision does not address or prohibit the common government practice of imposing permit conditions, such as impact fees, on new developments . . . .” The justices’ impression that applying the current Nollan/Dolan formula to impact fees would or even could “prohibit” them is unfounded. As Emily Hamilton and I wrote […]

Just 1 in 25 new apartments is owner-occupied. What happened to building condos?