Physical Address
304 North Cardinal St.
Dorchester Center, MA 02124
Physical Address
304 North Cardinal St.
Dorchester Center, MA 02124

Liberalizing Cities
From The Ground Up

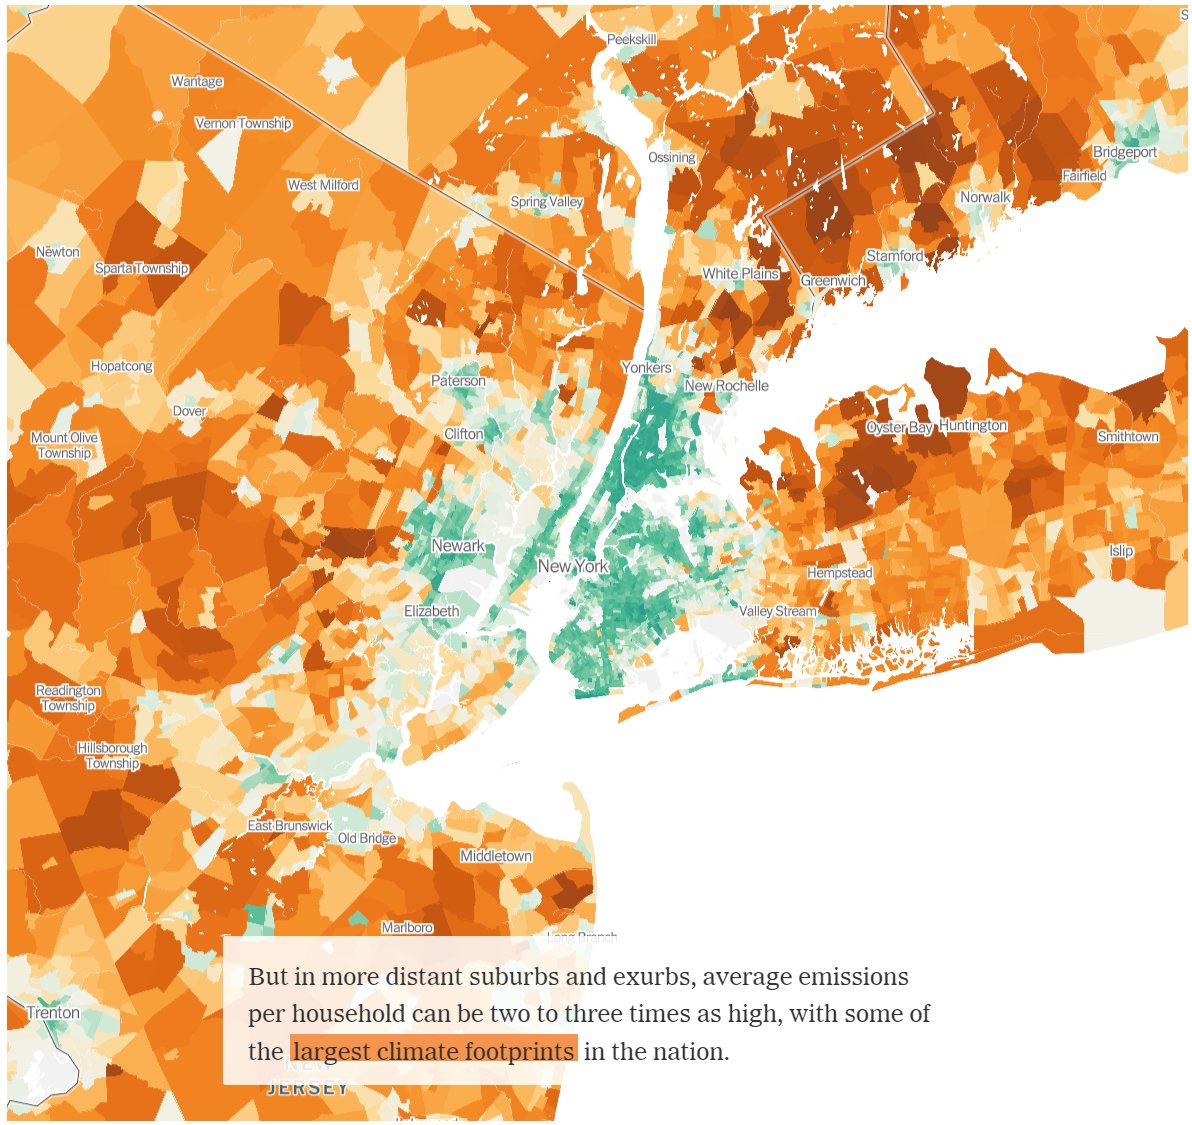
It’s pretty obvious that people use less energy when they live in urban areas versus suburbs: they take fewer and shorter drives and they heat and cool less square footage per person. But can that be quantified accurately at a local level and compared across disparate places? Maybe.
A recent story and interactive graphic from the New York Times have earned attention, showing estimates of greenhouse gas emissions by Census Tract, which implies a very fine level of detail:
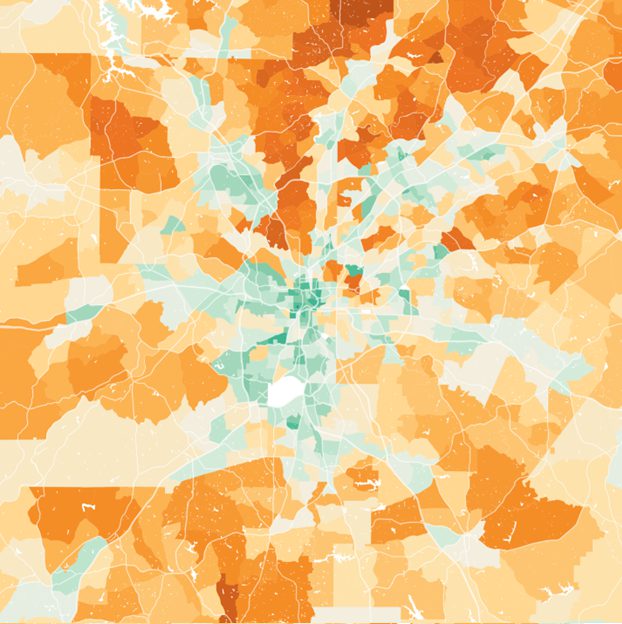
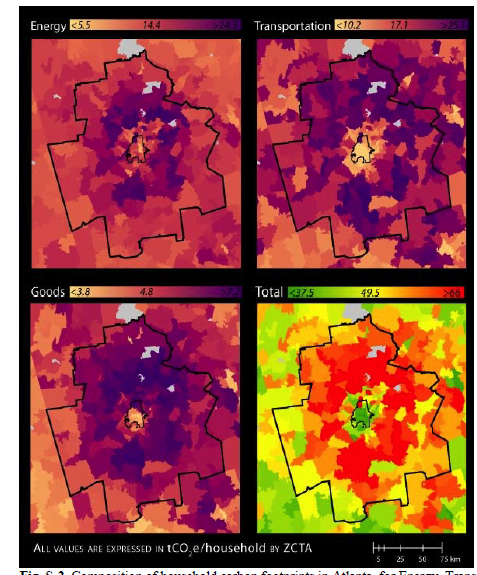
Chris Jones and his Berkeley research team have been working on this question for a decade. Images based on his 2014 paper with Daniel Kammen have cropped up on Twitter for years. A quick glance at the two Atlanta maps shows that there’s quite a bit of difference between the two editions, implying substantial changes in methods.

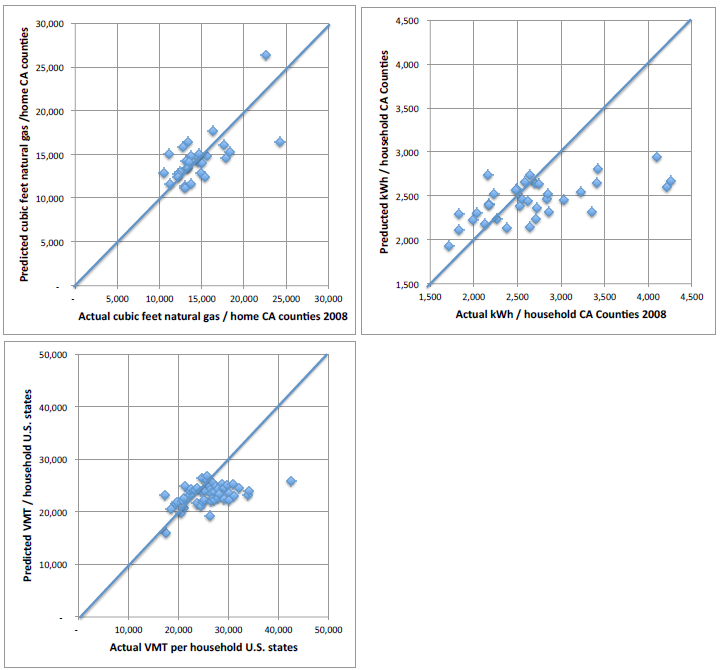
Looking under the hood at the 2014 paper, I found the methodology unconvincing. They had little localized data. Instead, they ran regressions based on national surveys and then predicted the local emissions data based on other local surveys that have overlapping information. Estimated emissions in a given location is thus a linear function of household size, racial shares, income, vehicle ownership, and some other variables. This is a reasonable approach, but the results looked bad. In their own comparison of model versus true data at county and state levels, their models only performed a little bit better than random. For vehicle miles traveled (VMT) and kilowatt hours of energy consumption, the model yields much less variation than the true data:
Jones and his team have refined and presumably improved their formulas over time. But they still rely on non-localized surveys to create estimates which they then project to localities.
The current methods are sketched out in the appendix to a 2020 paper and on EcoDataLab’s website. They don’t have similar scatterplots, but the EcoDataLab methods page defends the approach thus:
These models are the most robust models we could construct using recent and relevant data, and in many cases are a very strong fit. For instance, at the state level, our electricity and natural gas models have a goodness of fit R2 value of about 0.87 and 0.72, meaning they explain about 87% and 72% of the variation in household energy use, for their respective categories of energy. When comparing with specific city and county-level data, we typically find that these modeled results are within ~10% of the real-world data, providing sufficient accuracy for historical back-casting and local tract-level estimates of variation.
Certainly, a 0.7 to 0.9 R-squared sounds good, but revisit those 2014 scatterplots – the correlation between estimates and data would be quite high, but the 45 degree line shows that the model is underestimating the spatial variation in energy use and VMT. Is that still the case? We don’t know. The good news is that if the model is understating spatial variation, then it’s likely erring on the side of caution rather than magnifying small differences.
In reading the New York Times maps, it seems reasonable to draw broad spatial conclusions but not narrow ones. If there’s something that makes a neighborhood really unique, that won’t be represented.
A more important interpretive risk is that users really want a causal estimate, but Jones provides a descriptive one.
Any study of localized outcomes has to grapple with the fact that people carefully pick their location to match their lifestyle and culture – selection bias is thus massive, and controlling for observables will not come close to removing it. Thus, a person who wants to drive a big truck everywhere will use a lot of fuel whether he lives near transit or not, but he’s likely to choose a more driving-oriented area to fit his lifestyle.
Urbanists and zoning reformers would really like estimates that tell us how changing the built environment will change our own habits. But many of the variables that inform Jones’ estimates won’t change with environment: age, race, income, education. The fault is not in our stars, but in ourselves.