Physical Address
304 North Cardinal St.
Dorchester Center, MA 02124
Physical Address
304 North Cardinal St.
Dorchester Center, MA 02124

Liberalizing Cities
From The Ground Up
This book, available from solimarbooks.com, is a set of very short essays (averaging about three to five pages) on topics related to urban planning. Like me, Stephens generally values walkable cities and favors more new housing in cities. So naturally I am predisposed to like this book. But there are other urbanist and market books on the market. What makes this one unique? First, it focuses on Southern California, rather than taking a nationwide or worldwide perspective (though Stephens does have a few essays about other cities). Second, the book’s short-essay format means that one does not have to read a huge amount of text to understand his arguments. Because the book is a group of short essays, it doesn’t have one long argument. However, a few of the more interesting essays address: The negative side effects of liquor license regulation. Stephens writes that the Los Angeles zoning process gives homeowners effective veto power over new bars. As a result, the neighborhood near UCLA has no bars, which in turn causes UCLA students go to other neighborhoods to drink, elevating the risk to the public from drunk driving. The Brooklyn Dodgers’ move to Los Angeles; Los Angeles facilitated the transfer by giving land to the Dodgers- but only after a referendum passed with support from African-American and Latino neighborhoods. On the other hand, the construction of Dodger Stadium displaced a Latino community. To me, this story illustrates that arguments about “equity” can be simplistic. Los Angeles Latinos were both more likely than suburban whites to support Dodger Stadium, yet were more likely to be displaced by that stadium. So was having a stadium more equitable or less equitable than having no stadium? (On the other hand, a stadium that displaced no one might have been more equitable than either outcome). […]

With Spider-Man: Far From Home hitting theaters earlier this month, the Marvel Cinematic Universe has taken one of the series’ biggest risks yet: pulling Spider-Man out of New York City. The gravity of this decision is baked into the film’s title — with good reason. More than any other Marvel superhero, Spider-Man is a uniquely urban superhero. Of course, his iconic powers — web-slinging and wall-crawling — depend on a forest of skyscrapers. But on a deeper level, Parker’s problems are quintessentially urban. Repeatedly, Peter encounters the issue of housing affordability, a recurring challenge for him and Aunt May in the comics and a key issue in the Sam Rami films from 2002 to 2007. In the Rami trilogy, Uncle Ben’s death pushes the family’s already-precarious financial situation into a monetary melee. We witness Aunt May desperately attempt to refinance, though she ultimately faces foreclosure and eviction. Rami’s Spider-Man (2002) stays true to the comics in putting Peter Parker’s family in Forest Hills — a well-heeled Queens neighborhood, depicted in the films as lower-middle class. Their home was assessed this year at approximately $850,000, which would entail a monthly mortgage payment of roughly $3,700 after a hefty downpayment. To make this affordable, Uncle Ben and Aunt May need to somehow make $135,000, a year before property taxes and upkeep. If that’s a stretch for a professional electrician, it’s impossible for a retired homemaker. The frustrations surrounding Aunt May’s eviction are an important part of Parker’s decision to give up being Spider-Man in the second film, and it’s easy to see why: May’s options post-eviction aren’t pretty. Assuming a standard Social Security check and a payout from Uncle Ben’s death, Aunt May really only has about $1,000 to spend on rent. Rising rents will make it tough to find a decent […]
One common leftist argument against new housing is the “Red Vienna” argument: the claim that housing can only be affordable in places where the government dominates the housing market. Supporters of this claim like to mention Vienna, where (according to progressive lore) Big Brother builds lots and lots of super-affordable public housing, while the Big Bad Market is not involved. But a recent article about Vienna states that “one-third of the 13,000 new apartments built in Vienna each year are funded by the government and commissioned by the housing associations.” This means that about 8700 apartments are built every year by the private sector. In a city with 1.8 million people, that’s a lot. By contrast, in Manhattan (which has a comparable population) about 3000 housing units were built between 2014 and 2017- far less than Vienna. Even in Houston (which has a slightly bigger population) only 14,653 housing units of all types, or about 3700 per year, were built between 2014 and 2017. In other words, even if not a single unit of public housing had not been built, Vienna would still have built more than twice as many units as high-growth Houston, and about ten times as many as Manhattan. Vienna’s affordability is thus an argument in favor of lots more housing, not an argument in favor of NIMBYism.
Desire for Density is a new framework explaining how market prices form a desire path showing where the market could deliver more affordable housing than it presently is.?

Some commentators are slightly agog over an academic paper by Andres Rodrieguz-Pose and Michael Storper; Richard Florida writes that they shows that ” the effect of [housing] supply has been blown far out of proportion. ” Most of this paper isn’t really about the effect of housing supply on prices at all. Instead, the first 80 percent of the paper seems to argue that it makes no sense for low-skilled domestic workers to live in cities, because “Several decades ago mid-skilled work was clustered in big cities, while low-skilled work was most prevalent in the countryside. No longer; the mid-skilled jobs that remain are more likely to be found in rural areas than in urban ones.” (p. 20). The authors’ attack on upzoning is in the last few pages, and is based on broad, sweeping generalizations rather than actual data. First, they say that upzoning “would very likely involve replacing older and lower-quality housing stock in areas highly favoured by the market, effectively decreasing housing supply for lower income households in desirable areas.” (p. 30). They cite no source or data for this assertion- just pure conjecture. What’s wrong with their claim? First, such gentrification happens without upzoning; for example, in Chicago’s Lincoln Park, gentrification occurred through renovation of existing structures, rather than new, taller buildings- and of course places where new construction is politically difficult (such as San Francisco and Manhattan) are notorious for gentrification. Second, it assumes that new housing inevitably replaces older housing, rather than, say, vacant lots- an obvious overgeneralization.. Second, they rely on the “but we’re already building new housing!” argument. They cite a paywalled newpaper article to support this statement: “rents are now declining for the highest earners while continuing to increase for the poorest in San Francisco, Atlanta, Nashville, Chicago, Philadelphia, Denver, Pittsburgh, […]
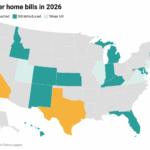
Anti poverty programs have been taking center stage as the 2020 Democratic primary heats up. Proposals from Kamala Harris and Corey Booker target high housing costs for renters and make for an interesting set of ideas. These plans, however, have major shortcomings and fail to address the fundamental problem of supply constraints in high cost housing markets. Harris and Booker on Housing Both the Harris and Booker plans call for direct subsidies to renters via the tax code. Harris’ Rent Relief Act (RRA) is a refundable tax credit for renters making $100,000 or less and spending more than 30% of their income on rent. The credit would be worth a percentage of the delta between the recipient’s rent (capped at 150% of area fair market rent) and 30% of their income. Actual benefits would be bigger or smaller depending on the size of the gap. Booker’s Housing, Opportunity, Mobility, and Equity (HOME) Act is also designed as a refundable tax credit for renters paying more than 30% of their income in rent. Unlike Harris’ RRA, there’s no sliding scale for benefits. The credit covers the entire difference between 30% of the recipients income and their rent (also capped by area fair market rent). Both programs are in the same vein as other democratic anti-poverty proposals which use the tax code to affect transfer payments. The others, though, are expansions of the federal Earned Income Tax Credit (EITC) whereas these two proposals more narrowly target housing. Devils in the Details Housing costs are a major impediment to financial stability for many, so it’s good to see reducing them called out as a poverty reduction strategy. And transfer payments (as opposed direct government provisioning or price fixing) make for better social safety nets. However, as Tyler Cowen points out, juicing the demand side […]

Five years ago everything in California felt like a giant (land use policy) dumpster fire. Fast forward to today we live in a completely different world. Yimby activists have pushed policy, swayed elections, and dramatically shifted the overton window on California housing policy. And through this process of pushing change, Yimbyism itself has evolved as well. Learning by Listening Yimbys started out with a straightforward diagnosis of the housing crisis in California. They said, “…housing prices are high because there’s not enough housing and if we want lower prices, we need more housing”. And they were, of course, completely right…at least with regards to the specific problem-space defined by supply, demand, and the long run. As Yimby’s started coalition building, though, they began recognizing related, but fundamentally different concerns. For anti-displacement activists, the problem was not defined by long-run aggregate prices. It was instead all about the immediate plight of economically vulnerable communities. Increasing supply was not an attractive proposal because of the long time horizons (years, decades) and ambiguous benefit for their specific constituencies. Yimbyism as Practical Politics Leaders in the Yimby movement could have thrown up their hands and walked away. But they didn’t. Instead they listened and developed a yes and approach. The Yimby platform still embraces the idea that, long run, we need to build more housing, but it now also supports measures to protect those who’ll fall off the housing ladder tomorrow without a helping hand today. Scott Weiner’s SB50 is a great example of this attitude in action. If passed, the bill will reduce restrictions on housing construction across the state. It targets transit and job rich areas and builds in eviction protections to guard against displacement. At a high level, it sets up the playing field so that renters in a four story […]
Both smart growth supporters and sprawl apologists focus on the needs of families with children: sprawl defenders argue that only suburbia can accommodate the desires of parents, while some smart growth types argue that cities should require lots of two- and three-bedroom units downtown because families need a lot of space. But a current exhibit at the National Building Museum in Washington suggests that this focus is a bit misguided. The exhibit points out that nearly 30 percent of U.S. households are singles living alone. Judging from all the planning-media blather about families, one might think that the housing market is focused on their needs, and that 30 percent or even more of the housing stock consisted of single-sized units. But the exhibit points out that in fact, less than 1 percent of housing units are studios, and about 12 percent are one-bedrooms. So family-oriented units are in fact overrepresented in the housing stock. Larger units may not dominate downtown, but they start to dominate pretty close to downtown. For example, when I looked at zillow.com I discovered that downtown Pittsburgh is dominated by one-bedroom units, but in zip code 15203 just south of downtown, 3/4 of housing units available for rent or sale have two or more bedrooms, including 80 out of 115 rental apartment listings. In zip code 15202 just northeast of downtown, 34 of 60 rental apartment listings, and 71 percent of all rental listings have two or more bedrooms. Of course, Pittsburgh is a pretty family-oriented city. But even in Washington’s 20036 zip code (a wealthy downtown neighborhood) 1/3 of all listings are for two or more bedrooms. And if you go just two subway stops north to Cleveland Park (zip code 20008) 108 out of 174 listings have two or more bedrooms. What about […]

Our tax code favors suburbia. Homeownership, greenfield development, and sprawl receive preferential tax treatment, and the market responds to incentives built into the code. As a result, a disproportionate amount of capital flows to those investments. In many cases, it has been an unintentional side effect of pursuing other goals. The combined effect is that our tax system plays a huge role in shaping our communities. Its influence is an important factor to understanding how residential design in the US became what it is today.
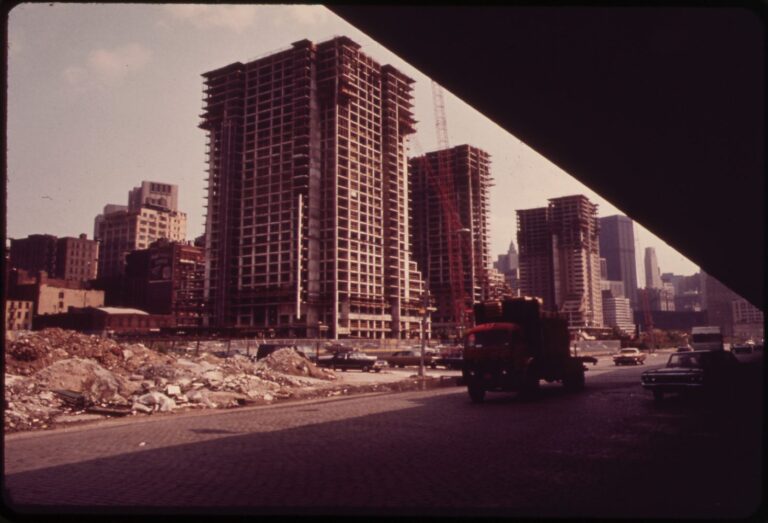
In a recent blog post, Julia Galef has generated a fairly comprehensive list of pro-housing arguments and counterarguments to those arguments. She gives the most detailed consideration to the “infinite demand” argument- in her words, “So even if SF adds a lot of additional housing, prices will still rise almost as quickly as they would have anyway, as long as demand to live here continues to soar. This view is mainly based on examples of other desirable cities, like New York or Singapore, which have built new housing at a faster rate than SF but nevertheless saw steep increases in price.” To which I respond: New York? Really? New York is only pro-housing when compared to San Francisco- which is a bit like saying Iran is a libertarian paradise compared to the Islamic State. In fact, New York has built housing at a glacial pace. Between 1960 and 1976, the number of new housing units completed per year ranged from just over 14,000 to over 60,000, and exceeded 20,000 in all but four years. In the almost forty years since 1976, the number of new units exceeded 20,000 in only four years (2006-10) and was above 14,000 for only ten years (1989, 2002, 2004-10, 2015). Meanwhile, demand for housing has increased: between 2006 and 2014 alone, the citywide renter population grew by 600,000. A better example of a “desirable city” would be a city where both the population and the housing supply is growing at a rapid rate- Raleigh, for example, or Las Vegas. These cities are much cheaper than New York or San Francisco.* Another example of a cheap, permissive city is Tokyo. But the post suggests Tokyo may not have grown as fast as American cities. In fact, Tokyo’s regional population grew by 17 percent since 1990- from 32.5 million […]