Physical Address
304 North Cardinal St.
Dorchester Center, MA 02124
Physical Address
304 North Cardinal St.
Dorchester Center, MA 02124
Headlines last month proclaimed that “Cities Have Grown More Diverse, And More Segregated, Since the 90s.” The headlines originate in the key findings of a new, detailed study from the Othering and Belonging Institute (OBI) at UC Berkeley. The study leans heavily on a relatively new metric – the Divergence Index – which has impressed many researchers (myself included) with its versatility. But now that we have seen the Divergence Index in action, its versatility clearly comes at a cost: the Divergence Index conflates what we would intuitively call diversity with “segregation.” As a result, more-diverse metro areas are usually ranked as more segregated by the Divergence Index. And as America became far more diverse over the past 30 years, it is logical that the Divergence Index would rise in most metro areas. Why is it so hard to measure segregation? Racial segregation is easy to see. You walk down the street and almost everybody in one neighborhood looks different than you and almost everybody in another neighborhood looks the same as you. The human eye and ear can also distinguish categories that are meaningful in some contexts but not others. Everybody but me in the café where I watched European soccer last week appeared to be not only Black but specifically Ethiopian. Was that café integrated or segregated? I certainly felt welcome as I bantered at the bar with an Ethiopian-American tennis instructor. But statistically, the café was far more Black and vastly more Ethiopian than the D.C. region as a whole. In this context, “segregation” refers to places where one group is overrepresented – like the café – not to the legal regime that imposed second-class citizenship and pervaded every aspect of life for black Americans. Given the word’s loaded history, it would have been wiser for social […]
The best book on zoning and NIMBYism you’ve never read might well be The Housing Bias by Paul Boudreaux. The author is a law professor, but you’d be forgiven for thinking he’s a journalist. His writing is engaging – and occasionally funny – and he does what is unthinkable for many scholars: drives to various places to interview people who are engaged in the (legal) drama of what we now call “the housing crisis.” Boudreaux had the misfortune of being ahead of his time. The housing market was so soft in 2011 that his book landed with nary a sound. A quick web search turned up no book reviews besides the publisher’s blurbs. The book (and you’ll be forgiven if you stop reading right here) will set you back. That’s unfortunate. Just a few years later, the book would have connected with passions shared by the rapidly growing YIMBY movement and a publisher would have marketed it to the masses. Boudreaux’s thesis is that “the laws that govern our use of land are biased in favor of one specific group of Americans—affluent, home-owning families—who least need the government’s help.” He keeps his ideological cards close to the vest. But that’s the point: one need not lean left or right to want to stop using the power of the state to comfort the comfortable and afflict the afflicted. The first chapter is the most important, because it lays out the foundation for all that local governments do, good and bad, in land use: the police power. He’s writing from Manassas, Virginia, where “restaurants with Aztec pyramids on them” telegraph the large Hispanic immigrant community. A vocal minority opposed this local immigration, and pressured local governments to stop it. Of course, the city doesn’t issue passports, but the police power allows local […]

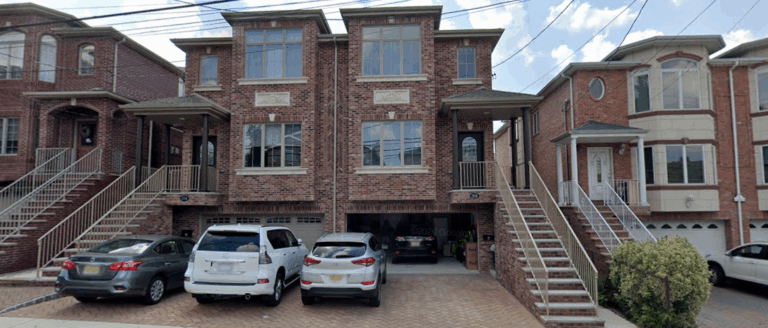
In two previous posts, I’ve raised questions about the competitiveness of missing middle housing. This post is more petty: I want to challenge the design rigidities that Daniel Parolek promotes in Missing Middle Housing. Although petty, it’s not irrelevant, because Parolek recommends that cities regulate to match his design goals, and such regulations could stifle some of the most successful contemporary infill growth. Parolek’s book suffers from his demands that missing middle housing match his own tastes. For instance, he has a (Western?) bias against three-story buildings. Having grown up in the Northeast, I think of three stories as the normal and appropriate height for a house. To each his own – but Parolek’s constant insistence on this point offers aid to neighborhood defenders who will be happy to quote him to make sure three-story middle housing remains missing. The house in the doghouse No form is in Parolek’s doghouse as much as the “tuck-under” townhouse, an attached house with a garage on the first floor. This is clearly a building that builders and buyers love: “If your regulations do not explicitly prohibit it, it will be what most builders will build” (p. 140). In fact, tuck-under townhouses are probably the most successful middle housing type around. In lightly-regulated Houston, builders small and large have been building townhouses, sometimes on courtyards perpendicular to the road. Parking is tucked. Townhouses are usually three stories tall (bad!), sometimes four. A few are even five stories. Their courtyards are driveways (also bad!). In a very different context – Palisades Park, NJ – tuck-under duplexes are everywhere. Their garages are excessive thanks to high parking minimums, but the form has been very successful nonetheless. These examples are not to be dismissed lightly: these are some of the only cases where widespread middle housing is […]

In yesterday’s post, I showed that missing middle housing, as celebrated in Daniel Parolek’s new book, may be stuck in the middle, too balanced to compete with single family housing on the one hand and multifamily on the other. But what about all the disadvantages that middle housing faces? Aren’t those cost disadvantages just the result of unfair regulations and financing? Indeed, structures of three or more units are subject to a stricter fire code. It’s costly to set up a condo or homeowners’ association. Small-scale infill builders don’t have economies of scale. Those, and the other barriers to middle housing that Parolek lays out in Chapter 4, seem inherent or reasonable rather than unfair. In particular, most middle housing types cannot, if all units are owner-occupied, use a brilliant legal tradition known as “fee simple” ownership. Fee simple is the most common form of ownership in the Anglosphere and it facilitates clarity in transactions, chain of title, and maintenance. Urbanists should especially favor fee simple ownership of most city parcels because it facilitates redevelopment. Consider a six-plex condominium nearing the end of its useful life: to demolish and redevelop the site requires bringing six owners to agreement on the terms and timing of redevelopment. A single-owner building can be bought in a single arms-length transaction. It’s no coincidence that the type of middle housing with the greatest success in recent years – townhomes – can be occupied by fee-simple owners, combining the advantages of owner-occupancy with the advantages of the fee simple legal tradition. Many middle housing forms enjoy their own structural advantage: one unit is frequently the home of the (fee simple) owner. By occupying one unit, a purchaser can also access much lower interest rates than a non-resident landlord. (This is thanks to FHA insurance, as Parolek […]

Everybody loves missing middle housing! What’s not to like? It consists of neighborly, often attractive homes that fit in equally well in Rumford, Maine, and Queens, New York. Missing middle housing types have character and personality. They’re often affordable and vintage. Daniel Parolek’s new book Missing Middle Housing expounds the concept (which he coined), collecting in one place the arguments for missing middle housing, many examples, and several emblematic case studies. The entire book is beautifully illustrated and enjoyable to read, despite its ample technical details. Missing Middle Housing is targeted to people who know how to read a pro forma and a zoning code. But there’s interest beyond the home-building industry. Several states and cities have rewritten codes to encourage middle housing. Portland’s RIP draws heavily on Parolek’s ideas. In Maryland, I testified warmly about the benefits of middle housing. I came to Missing Middle Housing with very favorable views of missing middle housing. Now I’m not so sure. Parolek’s case for middle housing relies so much on aesthetics and regulation that it makes me wonder whether middle housing deserves all the love it’s currently getting from the YIMBY movement. Can middle housing compete? Throughout the book, Parolek makes the case that missing middle construction cannot compete, financially, with either single-family or multifamily construction. That’s quite contrary to what I’ve read elsewhere. In a chapter called “The Missing Middle Housing Affordability Solution”, Daniel Parolek and chapter co-author Karen Parolek write: The economic benefits of Missing Middle Housing are only possible in areas where land is not already zoned for large, multiunit buildings, which will drive land prices up to the point that Missing Middle Housing will not be economically viable. (p. 56) On page 81, we learn, It’s a fact that building larger buildings, say a 125-150 unit apartment […]
New York City is an epicenter of the global novel coronavirus pandemic. Through April 16, there were 1,458 confirmed cases per 100,000 residents in New York City. Always in the media eye, and larger than any other American city, New York City has become the symbol of the crisis, even as suburban counties nearby suffer higher rates of infection. In a paper dated April 13, 2020, Jeffrey E. Harris of M.I.T. claims that “New York City’s multitentacled subway system was a major disseminator – if not the principal transmission vehicle – of coronavirus infection during the initial takeoff of the massive epidemic.” Oddly, he does not go on to offer evidence in support of this claim in his paper. Conversely, as I will show, data show that local infections were negatively correlated with subway use, even when controlling for demographic data. Although this correlation study does not establish causation, it more reliably characterizes the spread of the virus than the intuitions and visual inspections that Harris relies on. Data In an ongoing crisis with a shortage of tests, all infection and mortality data come with a major asterisk: we do not fully know the extent of the data. Only when all-cause mortality data and more-extensive testing data are available can any conclusions be confirmed. This study, like Harris’ and others, is subject to potentially massive measurement error. Data from the American Community Survey (2018 5-year averages) show that commuting modes vary extensively across New York City. New York is broken into Community Districts (CDs), which generally correspond (on either a one-to-one or two-to-one basis) with Census Public Use Microdata Areas (PUMAs). These 55 areas contain between 110,000 and 241,000 people each. The most car-dependent PUMA (Staten Island CD3) has a car-commute share of 75%; the least car-dependent PUMA is Manhattan […]