Physical Address
304 North Cardinal St.
Dorchester Center, MA 02124
Physical Address
304 North Cardinal St.
Dorchester Center, MA 02124

Liberalizing Cities
From The Ground Up

Why do elevators cost so much more in America? Stephen Smith's new work breaks down the differences and points to vital reforms.
One common anti-urbanist argument is that families simply don’t want to live in cities. But analysis by New York’s Department of City Planning (DCP) also shows that prosperous parts of New York City generally added children, at least in the decade before the rise of the COVID-19 virus. DCP divided the city into “neighborhood tabulation areas” (NTAs) with population ranging from 15,000 to 100,000. DCP’s data showed that the city as a whole lost 2 percent of its under-18 population between 2010 and 2020, but that some areas had significant gains. The biggest gainers were Long Island City (over 200 percent) and four areas where the under-18 population increased by between 50 and 75 percent (the Financial District, Midtown, Midtown South, and Downtown Brooklyn). There seems to be a positive correlation between child growth and housing supply growth, even in these expensive areas. In the Long Island City NTA, the number of housing units increased by over 100 percent between 2010 and 2020- so it is no surprise that the number of children increased. Housing supply increased significantly in three of the four NTAs that added the most children. The number of number of occupied housing units increased by 23 percent in the Midtown South NTA, by 26 percent in the Financial District NTA, and by 86 percent in the Downtown Brooklyn NTA. (Central Midtown was an exception to the rule; housing supply increased more slowly there). By contrast, in Manhattan as a whole, the number of housing units increased by only 7 percent, and the number of children actually declined. Moreover, affluent areas that added very little housing supply tended to gain under-18 residents at a much slower pace. For example, in the three Upper East Side (NTAs) (Lenox Hill, Carnegie Hill, Yorkville) the number of housing units increased […]
Cities have always invited us to be constantly on the move. We move around to get to work, go shopping, meet friends, attend a concert, visit an art exhibition, and take advantage of all the many activities that a metropolis offers.
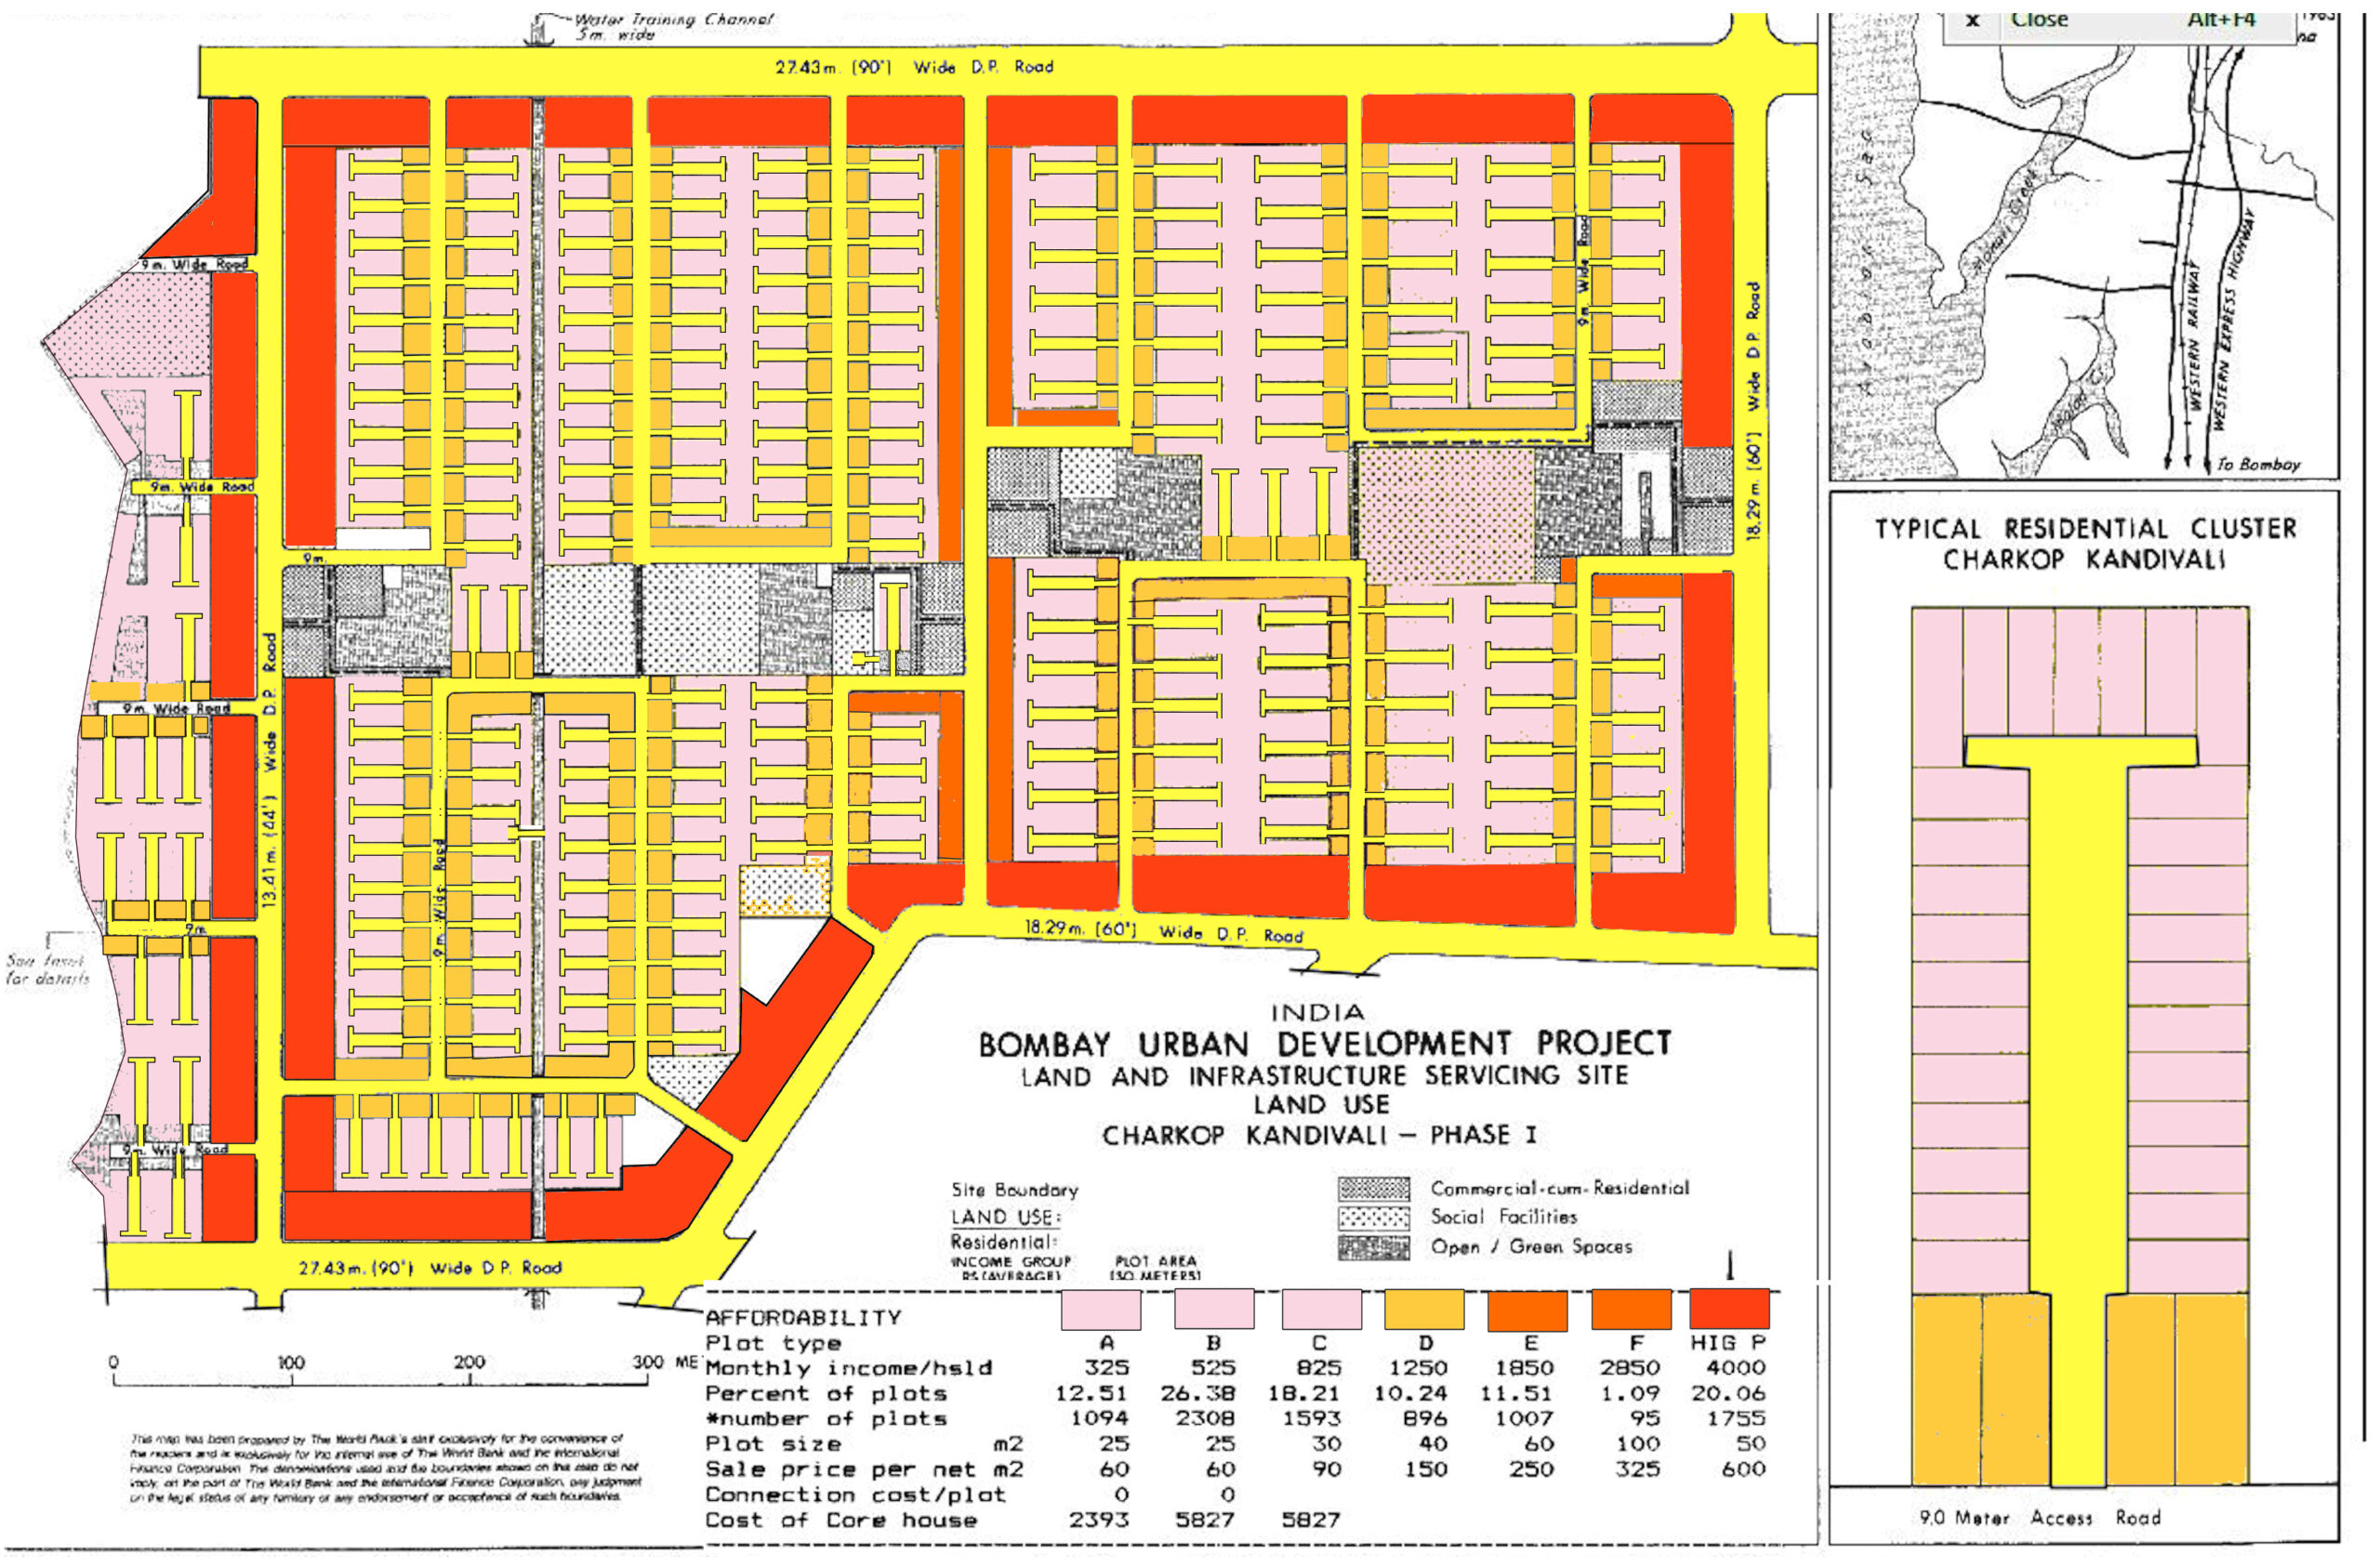
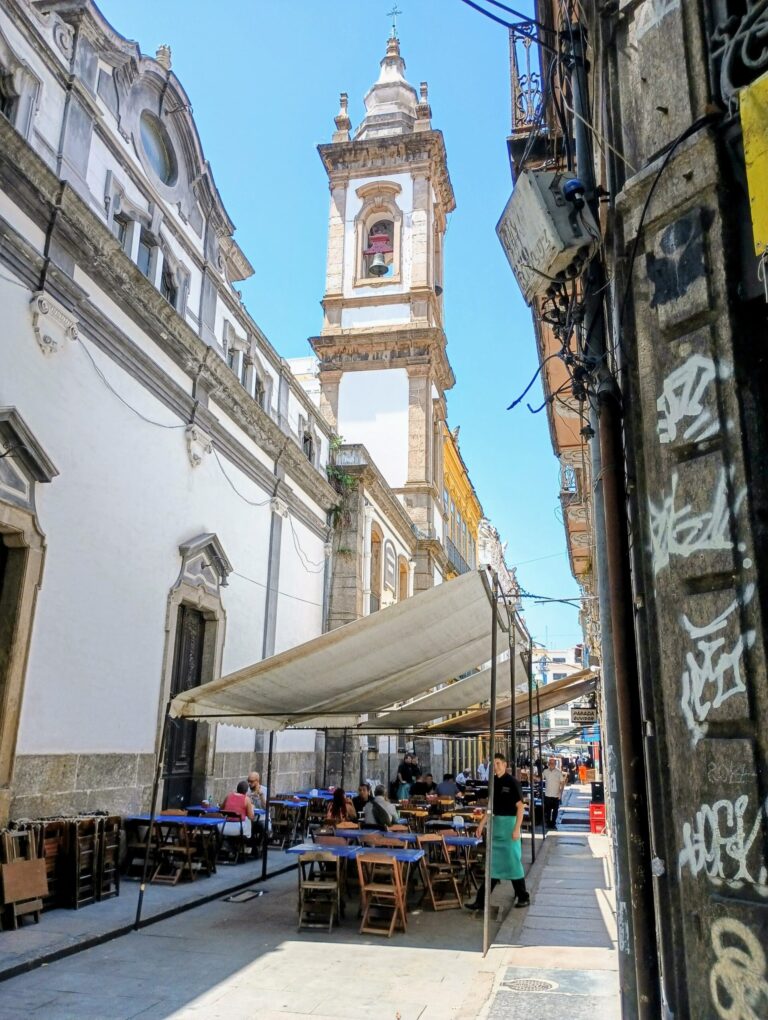
Alain Bertaud revisits a Mumbai development project he helped design in 1983. The neighborhood is thriving.
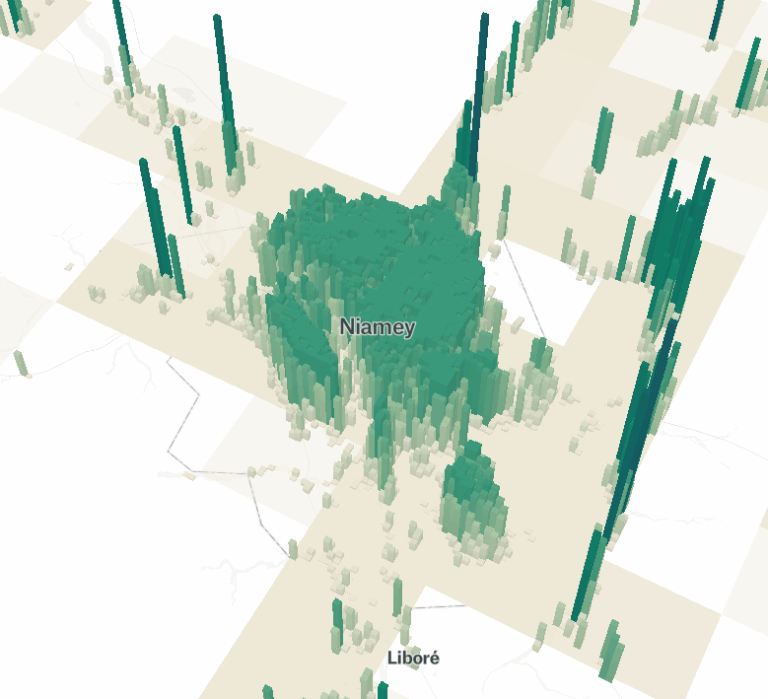
Three cool sites for data and visualizations

At the heart of Jane Jacobs’ The Economy of Cities is a simple idea: cities are the basic unit of economic growth. Our prosperity depends on the ability of cities to grow and renew themselves; neither nation nor civilisation can thrive without cities performing this vital function of growing our economies and cultivating new, and innovative, uses for capital and resources. It’s a strikingly simple message, yet it’s so easily and often forgotten and overlooked. Everything we have, we owe to cities. Everything. Consider even the most basic goods: the food staples that sustain life on earth and which in the affluent society in which we now reside, abound to the point where obesity has become one of the leading causes of illness. Obesity sure is a very real problem and one we ought to work to resolve (probably through better education and cutting those intense sugar subsidies). Yet this fact alone is striking! For much of mankind’s collective history, the story looked very different: man (and it usually was a man) would spend twelve or maybe more hours roaming around in the wild to gather sufficient food to survive. Our lives looked no different to the other animals with which we share the earth. An extract from The Economy of Cities: ‘Wild animals are strictly limited in their resources by natural resources, including other animals on which they feed. But this is because any given species of animal, except man, uses directly only a few resources and uses them indefinitely.’ What changed? Anthropologists, economists, and historians will tell you it was the Agricultural Revolution, which occurred when man began to settle in small towns and cultivate the agricultural food staples that continue to make up the bulk of our diet: wheat, barley, rice, corn, and animal food products. But […]
Kevin Erdmann offers a helpful corrective to the “YIMBY triumphalism” of claiming that large relative rent declines in Austin and Minneapolis are results of YIMBY policies. He’s mostly correct, especially about the rhetoric: arguing about housing supply from short term fluctuations is like arguing about climate change based on the week’s weather. Keep your powder dry, promise slow change and long-term stability, and recognize that demand shocks are responsible for most fluctuations. But Erdmann makes a stronger claim: Supply has never and will never cause a collapse of prices and rents. It causes stability. Is that true? In a case like Austin or Phoenix, sure: prices are not too far above the cost of construction, and abundant supply cannot (durably) push the price of new housing below the cost of construction. But YIMBY has more to offer to San Francisco, Auckland, or London. In those cases, prices are far above construction cost. That means that even when demand is relatively soft, there’s money to made in construction. As Erdmann allows: After a decade of more active construction in Auckland, rents appear to be 10% to 15% below the pre-reform trend. That’s a big win. After a decade. That’s what success looks like. That’s the promise – 5 to 15% relative rent declines, decade after decade. But there are several good reasons to believe this won’t happen in an even, steady pattern, at least not all the time. Hopefully by 2040 we’ll have data from several cases and be able to describe the dynamics of market restoration with much more confidence.

Jane Jacobs’ The Death and Life of Great American Cities, published in 1961, revolutionised urban theory. This essay kicks off a series exploring Jacobs’ influential ideas and their potential to address today’s urban challenges and enhance city living. Adam Louis Sebastian Lehodey, the author of this collection of essays, studies philosophy and economics on the dual degree between Columbia University and SciencesPo Paris. Having grown up between London and Paris, he is energised by the questions of urban economics, the role of the metropolis in the global economy, urban governance and cities as spontaneous order. He works as an Applied Research Intern at the Mercatus Center. Since man is a political animal, and an intensely social existence is a necessary condition for his flourishing, then it follows that the city is the best form of spatial organisation. In the city arises a form of synergy, the whole being greater than the sum of its parts, for the remarkable thing about cities is that they tap into the brimming potential of every human being. In nowhere but the city can one find such a variety of human ingenuity, cooperation, culture and ideas. The challenge for cities is that they operate on their own logic. Cities are one of the best illustrations of spontaneous order. The city in history did not emerge as the result of a rational plan; rather, what the city represents is the physical manifestation of millions of individuals making decisions about where to locate their homes, carry out economic transactions, and form intricate social webs. This reality is difficult to reconcile with our modern preference for scientific positivism and rationalism. But for the Polis to flourish, it must be properly understood by the countless planners, reformers, politicians and the larger body of citizens inhabiting the space. Enter Jane […]

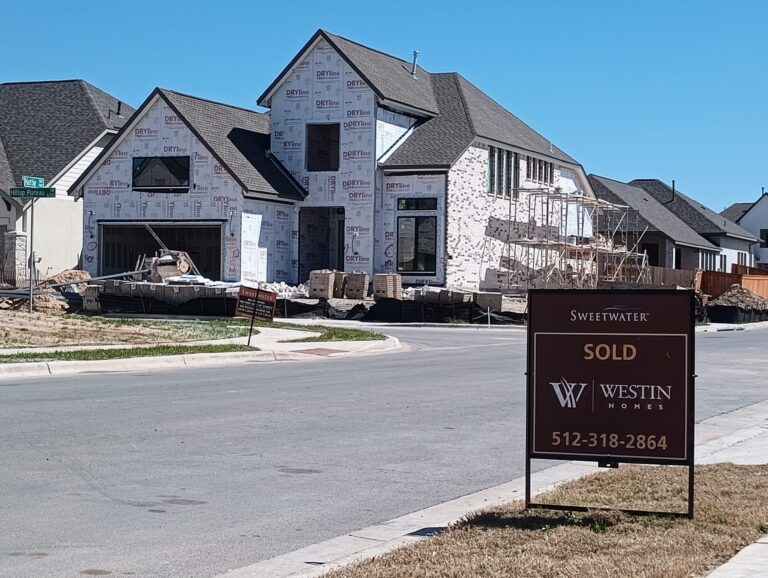
The benefit-cost ratio of housing supply subsidies looks terrible. And the state of research is even worse.

The traditional model of cities proves useful yet again - even when researchers neglect their discipline's roots.