Physical Address
304 North Cardinal St.
Dorchester Center, MA 02124
Physical Address
304 North Cardinal St.
Dorchester Center, MA 02124

Liberalizing Cities
From The Ground Up
The CityNerd Youtube channel has a video on the ten U.S. cities “that are becoming most city-like.” One of Citynerd’s criteria grabbed my attention: he gives credit for cities having an increase in “car-lite households”, by which he means having…
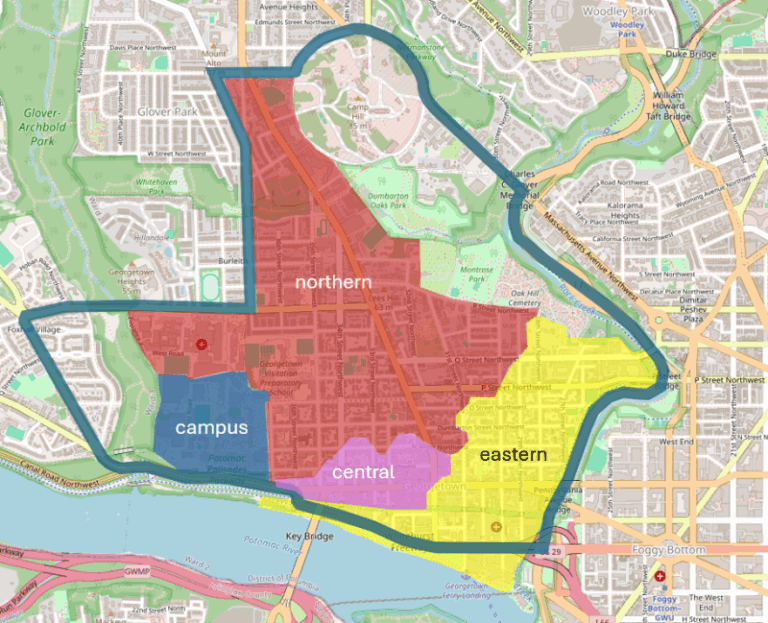
In Greater Greater Washington, my dad and I have a new editorial explaining how a ring-and-access traffic circulation plan inspired by the Netherlands can keep necessary traffic moving while delivering neighborhood streets and iconic shopping streets from traffic. Read the…
One argument against Manhattan’s congestion pricing plan is that it merely redistributes congestion and pollution to nearby neighborhoods and suburbs, as drivers choose alternative routes that avoid midtown and downtown Manhattan. If this was true, air quality would decrease citywide…
On April 17, 1980, the Washington Post ran a curious paragraph, reporting a five-year-old quote for the first time – one withheld originally out of deference to the source: [Douglas Schneider’s] views of urban transportation were spelled out clearly in…
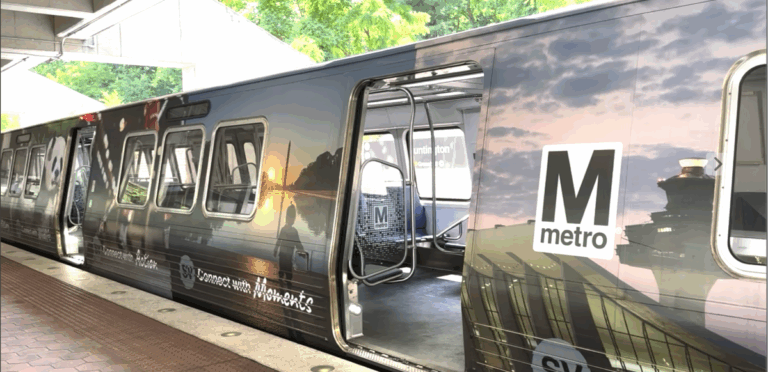
Colleges are the perfect place for walkable neighborhoods, yet many colleges don’t focus on Transit Oriented Development. The Purple line going through the University of Maryland is a key expansion point for the D.C metro and will allow greater connections…
In New York City, one common argument against congestion pricing (or in fact, against any policy designed to further the interests of anyone outside an automobile) is that because outer borough residents are all car-dependent suburbanites, only Manhattanites would benefit. For example, film critic John Podhoretz tweeted: “Yeah, nothing easier that taking the subway from Soundview or Gravesend or Valley Stream.” Evidently, Podhoretz thinks these three areas are indistinguishable from the outer edges of suburbia: places where everyone drives everywhere. But let’s examine the facts. Soundview is a neighborhood in the Southeast Bronx, a little over 8 miles from my apartment in Midtown Manhattan near the northern edge of the congestion pricing zone. There are three 6 train subway stops in Soundview: Elder Avenue, Morrison Avenue, and St. Lawrence Avenue. Soundview zip codes include 10472 and 10473. In zip code 10472* only 25.7 percent of workers drove or carpooled to work according to 2023 census data; 59.6 percent use a bus or subway, and the rest use other modes (including walking, cycling, taxis and telecommuting). 10473, the southern half of Soundview, is a bit more car-oriented- but even there only 45 percent of workers drive alone or carpool. 41 percent of 10473 workers use public transit- still a pretty large minority by American standards, and more than any American city outside New York. In the two zip codes combined there are just 45,131 occupied housing units, and 24,094 (or 53 percent) don’t have a vehicle. In other words, not only do most Soundview residents not drive to work, most don’t even own a car. Gravesend, at the outer edge of Brooklyn over 12 miles from my apartment, is served by three subway stops on the F train alone: Avenue P, Avenue U and Avenue X. It is also served by […]
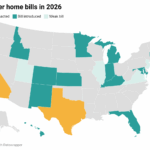
In recent years, three states have legalized or decriminalized jaywalking: Virginia and Nevada did so in early 2021, and California legalized jaywalking at the start of 2023. The traditional argument for anti-jaywalking laws is that they protect pedestrians from themselves, by limiting their ability to walk in dangerous traffic conditions. If this argument made sense, we would have seen pedestrian traffic fatalities increase in less punitive states. For example, if jaywalking laws were effective, California’s pedestrian death rate would have increased in 2023 (when jaywalking was legalized). Instead, the number of deaths decreased from 1208 to 1057, a 12 percent drop. (Relevant data for all states is here). Although pedestrian deaths decreased nationally, the national decrease was only about 5 percent (from 7737 to 7318). On the other hand. the data from Nevada and Virginia is less encouraging. As noted above, jaywalking was decriminalized in those states in 2021, so the relevant time frame is 2021-23. During this period, pedestrian deaths increased quite modestly in Virginia (from 125 to 133) and more significantly in Nevada (from 84 to 109). On balance, it does not seem that there is a strong trend in either direction in these three states- which (to me) supports my previously expressed view that Americans should be trusted to walk where they like rather than being harassed by the Nanny State.
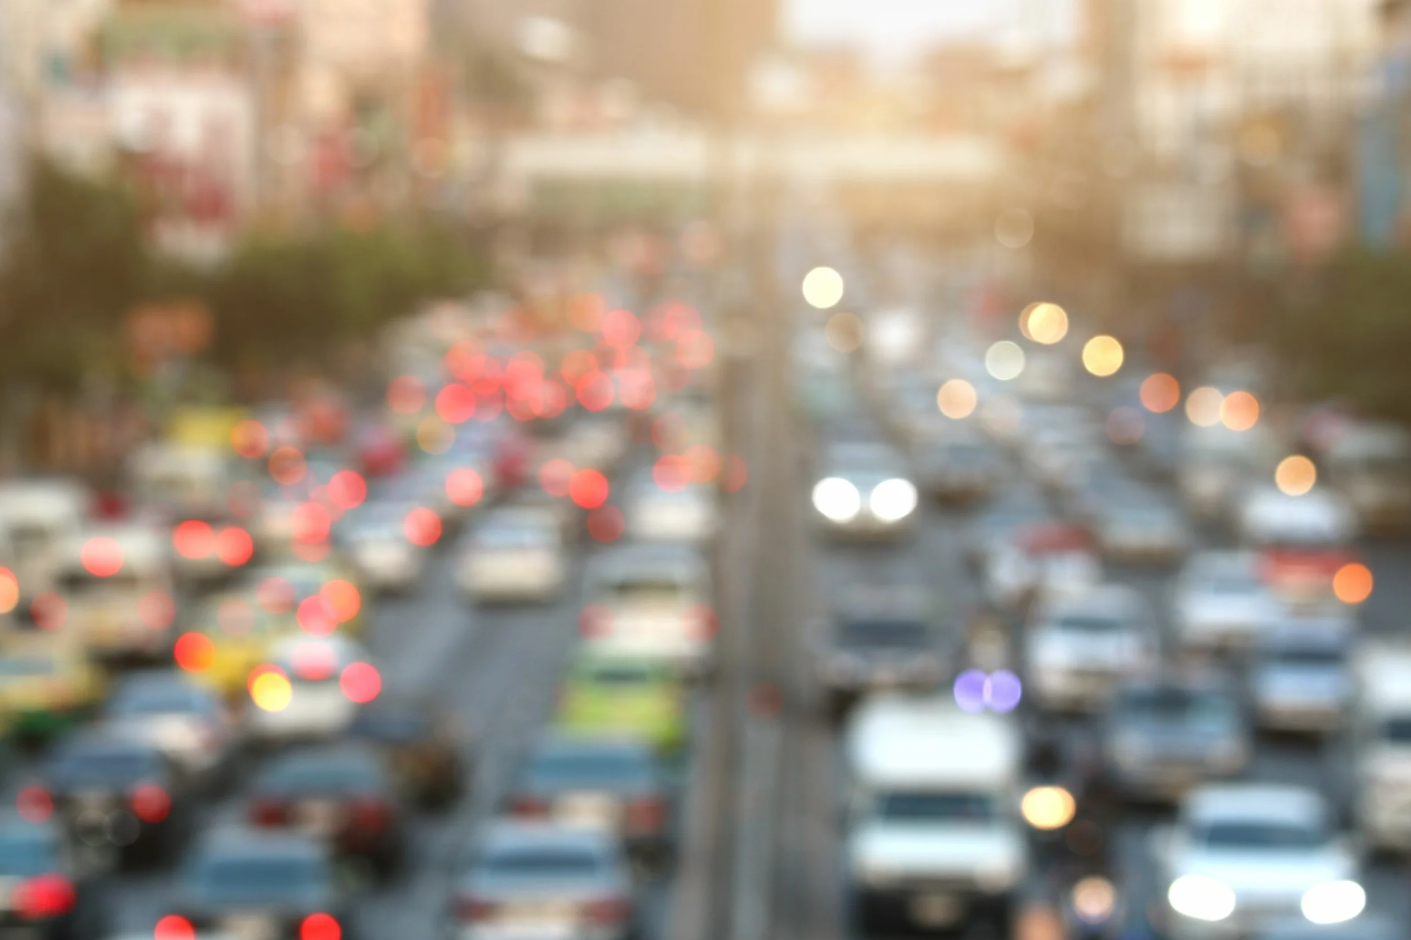
Autonomous vehicles will cause a congestion apocalypse on downtown streets unless we price their use of the roads.
The goal of congestion pricing is not to penalize car trips but to smooth demand over a more extended time to reduce congestion. Unfortunately, many new congestion pricing schemes seem designed to ban cars rather than manage demand for car trips. This article appeared originally in Caos Planejado and is reprinted here with the publisher’s permission. Congestion pricing aims to reduce demand for peak-hour car trips by charging vehicles entering the city center when roads are the most congested. Charging rent for the use of roads is consistent with a fundamental principle of economics: when the price of a good or service increases, demand for it decreases. Charging different rates depending on the congestion level spreads trip demand over a longer period than the traditional peak hour. The goal of congestion pricing is not to penalize car trips but to smooth demand over a more extended time to reduce congestion. Unfortunately, many new congestion pricing schemes seem designed to ban cars rather than manage demand for car trips. Congestion pricing then becomes more akin to the “sin taxes” imposed on the consumption of tobacco and alcohol than to traffic management. The traffic on urban roads in a downtown area is not uniform during the day but is subject to rush hour peaks, while late-night road networks are usually underused. The use of roads in the downtown area is similar to other places like hotels in resort towns. Hotels try to spread demand away from peak season by reducing prices when demand is low and increasing prices when demand is high. When resort hotels charge higher prices during weekends and vacations, it is not to discourage demand but to spread demand over a broader period. Well-conceived congestion pricing for urban roads works under the same principles as the pricing of hotels. […]
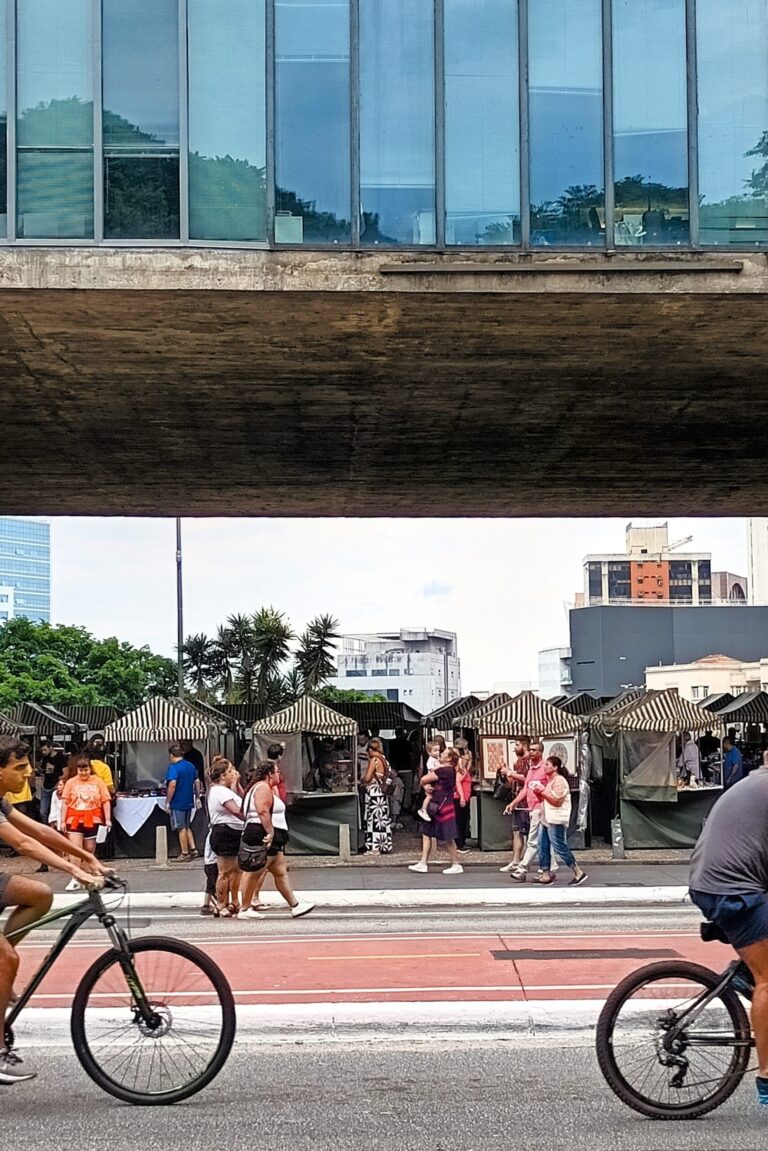
Because there are no market signals that could identify the best and highest use of street space, it is the role of urban planners to allocate the use of street space between different users and to design boundaries between them where needed.