Physical Address
304 North Cardinal St.
Dorchester Center, MA 02124
Physical Address
304 North Cardinal St.
Dorchester Center, MA 02124

Liberalizing Cities
From The Ground Up

Check out Dan Bertolet’s review of the productive legislative year in Washington, where lawmakers preempted local parking, design, and unfunded inclusionary zoning requirements, among other things.
If investors and hedge funds are a major cause of high housing costs, why do they seem to be most common in cheap cities?
With a divided and highly polarized state government, North Carolina hadn’t gotten much done on housing and land use policy in the past few years. That changed unexpectedly last fall, when S 382, a controversial bill that combined hurricane relief…
I recently read about an interesting logical fallacy: the Morton’s fork fallacy, in which a conclusion “is drawn in several different ways that contradict each other.” The original “Morton” was a medieval tax collector who, according to legend, believed that someone who spent lavishly you were rich and could afford higher taxes, but that someone who spent less lavishly had lots of money saved and thus could also afford higher taxes. In other words, every conceivable set of facts leads to the same conclusion (that Morton’s victims needed to pay higher taxes). To put the arguments more concisely: heads I win, tails you lose. It seems to me that attacks on new housing based on affordability are somewhat similar. If housing is market-rate, some neighborhood activists will oppose it because it is not “affordable” and thus allegedly promotes gentrification. If housing is somewhat below market-rate, it is not “deeply affordable” and equally unnecessary. If housing is far below market-rate, neighbors may claim that it will attract poor people who will bring down property values. In other words, for housing opponents, housing is either too affordable or not affordable enough. Heads I win, tails you lose. Another example of Morton’s fork is the use of personal attacks against anyone who supports the new urbanism/smart growth movements (by which I mean walkable cities, public transit, or any sort of reform designed to make cities and suburbs less car-dominated). Smart growth supporters who live in suburbs or rural areas can be attacked as hypocrites: they preach that others should live in dense urban environments, yet they favor cars and sprawl for themselves. But if (like me) they live car-free in Manhattan, they can be ridiculed as eccentrics who do not appreciate the needs of suburbanites. Again, heads I win, tails you lose.
In a recent post, I revealed the 91 large cities and counties that consistently fail to report complete data to the federal Building Permit Survey (BPS). But what about smaller jurisdictions, which often have weak record-keeping and slim staffs – and what about states made up of many such small jurisdictions? The gold standard for counting housing units is the Decennial Census. That shows that the number of homes in Massachusetts grew from 2,622,000 in 2000 to 2,808,000 in 2010 to 2,998,000 in 2020. Even though building permits do not always result in completed homes, local reports and Census Bureau interpolations fall well short: It’s possible that some building permits pulled in 2007-2009 were delayed by the Great Recession but completed after the 2010 census. Taking the twenty-year period together, the BPS (2000-2019) is only picking up 84 percent of completed homes – not to mention those that are permitted but abandoned. Looking ahead, Gov. Healey’s administration has estimated (poorly) that the commonwealth needs 222,000 new homes by 2035. How does that compare to recent production? We don’t have a 2024 Census. But if we assume that reported 2015-2024 building permits turn into housing at the same rate that 2000-2019 building permits did, we can get a working estimate. The BPS reports 167,000 Bay State building permits from 2015 through 2024 (with extrapolation for December, 2024). That means that something closer to 199,000 new homes were likely completed in that period. If that’s true, then the administration’s “housing need” estimate is just 12% higher than recent construction – which has been inadequate to prevent a huge upswing in rents and prices.
A review of a book that endorses more flexible zoning, but doesn't reject zoning entirely.

We identified large 91 cities and counties that regularly fail to report their building permits to the Census Bureau - including some surprising culprits.
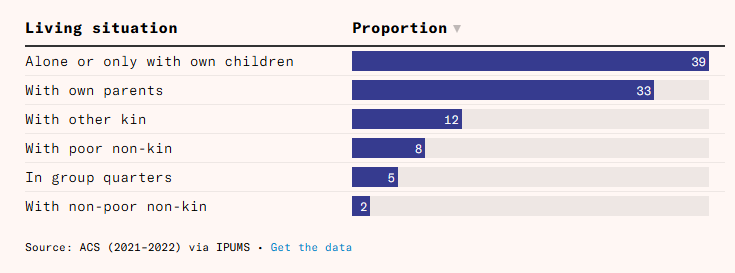
We can all understand the distinction between individual and systemic causes of homelessness. Can we apply the same rigor to potential solutions?
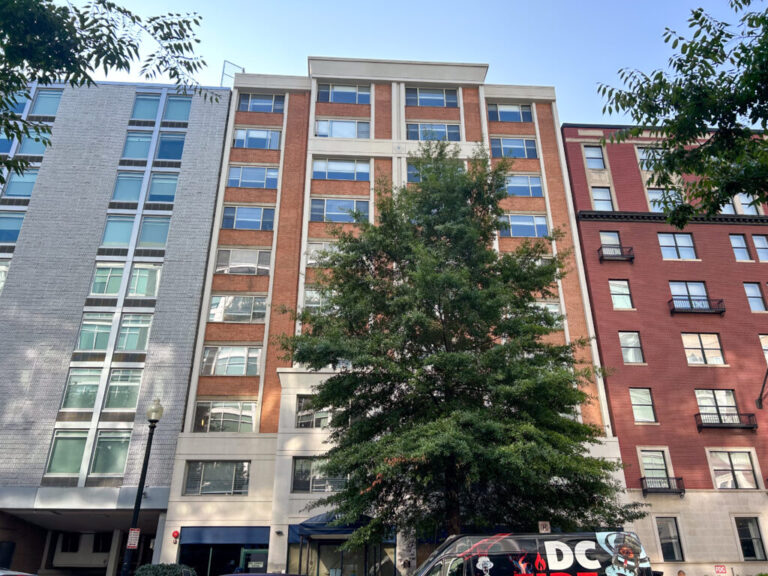
An old dorm becomes a new shelter for homeless families in DC.
The conventional wisdom (based on Census estimates) seems to me that urban cores have lost population since COVID began, but are beginning to recover. But mid-decade Census estimates are often quite flawed. These estimates are basically just guesses based on complicated mathetmatical formulas, and often diverge a bit from end-of-decade Census counts. Is there another way to judge the popularity of various places? Perhaps so. I just uncovered a database of real estate price trends from Redfin. Because housing supply is often slow to respond to demand trends, housing prices probably reflect changes in demand. What do they show? First let’s look at the most expensive cities: San Francisco and New York City where I live now. If conventional wisdom is accurate, I would expect to see stagnant or declining housing prices in the city and some increase in suburbia. In Manhattan, the median sale price for condos and co-ops was actually lower in 2024 than it was in mid-2019, declining from $1.25 million in August 2019 to $1.05 million in August 2024.* Similarly, in the Bronx multifamily sale prices decreased slightly (though prices for single-family homes increased). By contrast, in suburban Westchester County, prices increased by about 30 percent (from just under 250k to 325k). Similarly, in Nassau County prices increased from 379k to 517k, an increase of well over one-third. So these prices suggest something like a classic suburban sprawl scenario: stagnant city prices, growing suburban prices. In San Francisco, by contrast, property values declined everywhere. City prices declined from $1.2 million in August 2019 to just under $1 million today; in suburban Marin County, the median price declined from $633k to $583k. So sale price data certainly supports the narrative of flight from expensive cities. What about places that are dense but not quite as expensive? But […]