Physical Address
304 North Cardinal St.
Dorchester Center, MA 02124
Physical Address
304 North Cardinal St.
Dorchester Center, MA 02124

Liberalizing Cities
From The Ground Up
Updated 3/23 to add Minnesota & second Idaho bill, 2/19 to add Michigan, 2/17 to add Kentucky, 2/16 to add Idaho, 2/11 to add Connecticut; 2/5 to add Colorado; and 1/30 to add Hawaii, Kansas, New Mexico, and Rhode Island.…
A recent “supply skeptic” paper by various academics has gotten a lot of attention in housing-related social media. The somewhat sensationalistic title is: “Inequality, not regulation, drives America’s housing affordability crisis.” But unlike most random rants from “not in my…
I recently read a report from one of Georgetown Law School’s many centers, discussing the shortage of low-income housing in six metro areas with high housing growth. * The report points out that owner-occupied units built since 2010 are far…
Every so often I read a tweet or listserv post saying something like this: “If modern buildings were prettier there’d be less NIMBYism.” I always thought this claim was silly for the simple reason that in real-life rezoning disputes, people…
I am arguing on Twitter about whether New York City (where I live) could really build a significant amount of new housing if zoning was less restrictive. One possible argument runs something like this: “New York is so built out…
Conservative commentator Ben Shapiro has received some publicity for stating: “If you can’t afford to live here [in New York City] maybe you should not live here.” From the standpoint of advice to individuals, this statement of course makes perfect…
Sometimes, opponents of new housing claim that they aren’t really against all housing- they just want housing to be “gentle density” (which I think usually means “not tall”), or “affordable” (which I think usually means “lower-income housing”). Even if these…
Preservationists treat pre-1950 architecture as “historic” and irreplaceable, while often criticizing new building on a variety of aesthetic grounds. In his new book The Unfinished Metropolis, Benjamin Schneider points out that today’s historic buildings weren’t so popular when they were…
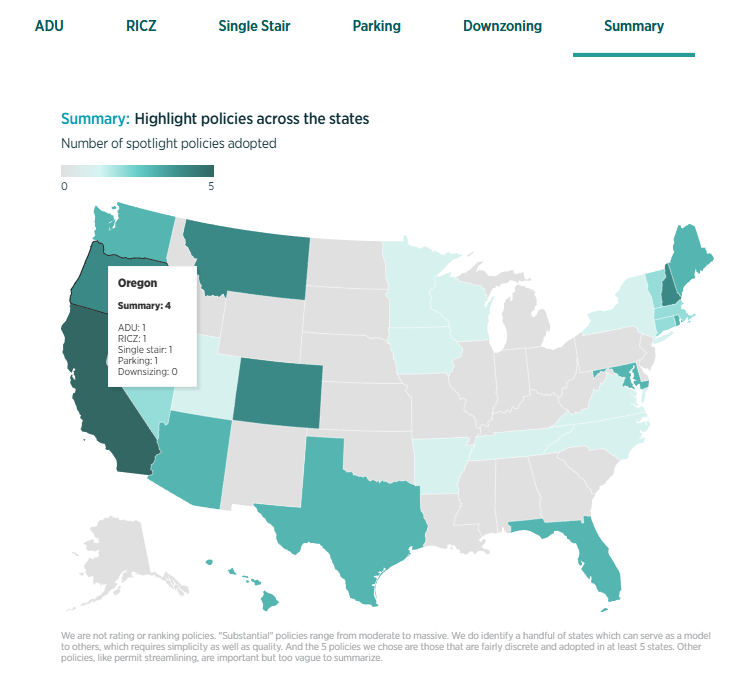
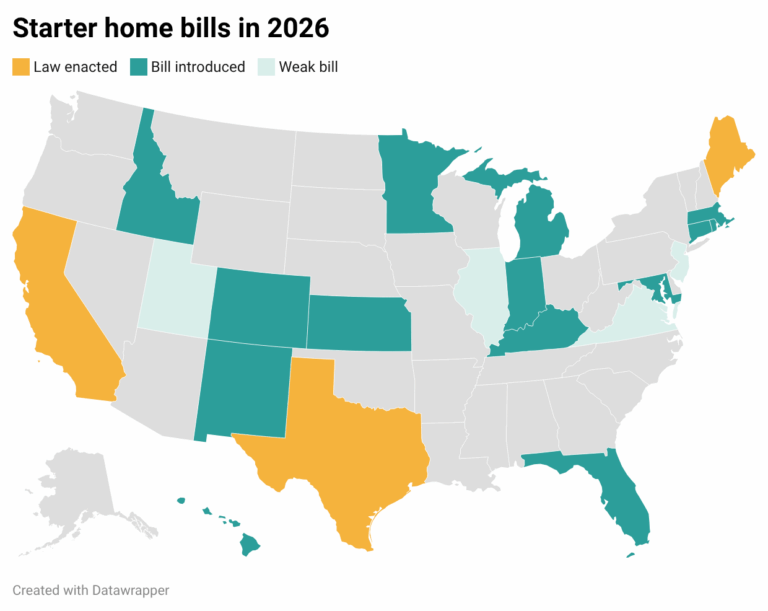
With a hugely productive legislative season in 2025, pro-homes legislators are rapidly taking good ideas around the country. To keep track of it all, my team created a new set of interactive maps. You can see snapshots here: Our goal…
In Chapters 2 and 3, Ellsworth tries to argue for supply skepticism- that is, the idea that new housing (or at least the high-end towers that she opposes)* will not reduce rents or housing costs. She has made some effort…