Physical Address
304 North Cardinal St.
Dorchester Center, MA 02124
Physical Address
304 North Cardinal St.
Dorchester Center, MA 02124

Liberalizing Cities
From The Ground Up
Over the past week, the press was chock full of 2020-style headlines like “Census Bureau Confirms Pandemic Exodus from SF.” That’s because according to the Census Bureau, virtually every urban county in the U.S. (even urban counties in growing metros like Dallas and Atlanta) lost population between July 2020 and July 2021. But is the hype justified? I suspect not, for a variety of reasons. First of all, Census Department estimates have, in recent years, tended to underestimate urban populations, at least in some cities. For example, in 2019 the Census estimated Manhattan’s population as 1.628 million, while the actual count of 2020 showed 1.694 million residents- an underestimation of over 65,000 people. The Census estimated Brooklyn’s population at 2.559 million, but the actual count showed 2.736 million- an underestimate of over 150,000. (On the other hand, the 2020 population count was actually a bit lower than the 2019 estimates for Washington and San Francisco). Second, even the 2020 Census probably undercounted cities more than it undercounted suburbs. How do we know this? Because according to the Census Bureau itself, it undercounted Blacks by 3 percent and Hispanics by 5 percent, while slightly overcounting whites. These groups tend to be more urban than suburban (at least compared to whites) – so if the Census undercounted these groups, it probably undercounted urban population generally. Third, the timing of the Census Bureau’s estimates does not quite make sense to me. By July 2021, rents had already began to rise in Manhattan; the low rents of February and March were already disappearing. This suggests that by July, population (and thus demand) was increasing. Fourth, even if the Census Bureau’s population estimates were valid for the summer of 2021, they certainly aren’t valid any more. How do we know? It seems pretty obvious that […]

Are there diverse places in the U.S. where racial differences among residents are small enough to be undetectable to a typical resident? Places where Roger Starr's ideal of "integration without tears" might be a reality, where people of different races socialize as equals, share culture and priorities, and work in the same range of occupations?
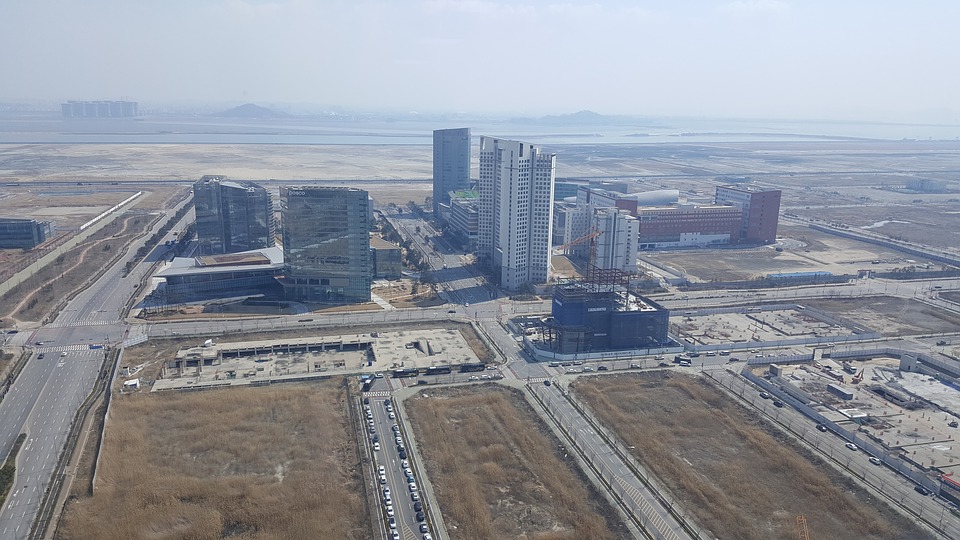
Urbanist and YIMBY Twitter had a field day dunking on Nathan J. Robinson, whose essay in his publication Current Affairs called for building new cities in California. But California really could use some new cities - and we need to think about them in primarily economic terms.
One argument I have run across recently is that the high cost of housing is caused by mysterious corporate investors are buying up real estate and forcing up the cost. The stupidest version of this argument is that investors are hoarding all the real estate. Why is it stupid? Because corporations like to make money, and a corporation that doesn’t sell or rent out real estate is making no money from it. A more sensible version of the argument is that the existence of investors adds demand for housing, and thus that their presence thus increases housing costs.* But even if this true, are these investors really a significant factor in the housing market? In today’s Washington Post, an article supplies data for 40 metro areas. If investors are really the problem, one might think that the most expensive metros have the highest investor share. But this is simply not the case. In San Francisco, only 6 percent of for-sale houses are being purchased by investors (about the same as the 2015 share). In metro New York and Los Angeles, that share is around 10-11 percent. The most investor-heavy markets are in growing, medium-cost Sun Belt markets like Atlanta (25 percent), Charlotte (25 percent), Jacksonville (22 percent) and Phoenix (21 percent). And within those markets, investors are not buying in the most expensive areas. In Atlanta, the highest investor shares are in the lower-income Southside, and low and moderate-income southern and western suburbs. In Jacksonville, the mostly lower-income Northside and the working-class Westside have higher investor shares than the more middle-class Southside. This pattern seems to hold in less investor-heavy metros as well: even though some affluent Manhattan zip codes have high investor shares, most of the high-investor zip codes are in East Harlem, the South Bronx, and other poor […]
One argument against bus lanes, bicycle lanes, congestion pricing, elimination of minimum parking requirements, or indeed almost any transportation improvement that gets in the way of high-speed automobile traffic is that such changes to the status quo might make sense in the Upper West Side, but that outer borough residents need cars. This argument is based on the assumption that almost anyplace outside Manhattan or brownstone Brooklyn is roughly akin to a suburb where all but the poorest households own cars and drive them everywhere. If this was true, outer borough car ownership rates and car commuting rates would be roughly akin to the rest of the United States. But in fact, even at the outer edges of Queens and Brooklyn, a large minority of people don’t own cars, and a large majority of people do not use them regularly. For example, let’s take Forest Hills in central Queens, where I lived for my first two years in New York City. In Forest Hills, about 40 percent of households own no car. (By contrast, in Central Islip, the impoverished suburb Long Island where I teach, about 9 percent of households are car-free- a percentage similar to the national average). Moreover, most of the car owners in Forest Hills do not drive to work. According to the U.S. Census Bureau’s American Community Survey (ACS), only 28 percent of the neighborhood’s workers drive or carpool to work. Admittedly, Forest Hills is one of the more transit-oriented outer borough neighborhoods. What about the city’s so-called transit deserts, where workers rely solely on buses? One such neighborhood, a short ride from Forest Hills, is Kew Gardens Hills. In this middle-class, heavily Orthodox Jewish neighborhood, about 28 percent of households are car-free- not a majority, but again high by American or suburban standards. And even […]

In the standard urban growth model, a circular city lies in a featureless agricultural plain. When the price of land at the edge of the city rises above the value of agricultural land, “land conversion” occurs. In the real world, we’re more likely to call it “development” and it is, of course, a lot more complicated. Simplification is valuable and gives us more general insights. But is greenfield development complicated in ways that are interesting and might change the results of urban economic models? Or that might change the ways we think or talk about development policy? Witold Rybczynski’s 2007 book Last Harvest helps answer these questions. It tracks a specific cornfield in Londonderry, Pennsylvania, from the retirement of the last farmer to the moving boxes of the first resident. With its zoomed-in lens, Last Harvest answers (or at least raises) lots of questions that are interesting but not especially important in the grand scheme: Why do expensive homes mix some top-line finishes with cheap, plasticky ones? Why do anti-development communities permit any subdivisions at all? What is ‘community sewerage,’ and how does it work? Exactly who thinks it’s attractive to have brick and vinyl cladding on the same house? What’s it like to buy a house from a national homebuilder? Does Chester County really produce forty percent of America’s mushrooms? The Stack Rybczynski does not use this term, but what he describes is part of what I call the “stack” of housing supply. One of the central facts of development is that it relies on a very long chain of industries and professions, each of which relies on every other part of the stack doing its job. If one part is left undone, nobody gets paid: ‘Without a water contract, we can’t get a permit for the water mains, […]
Headlines last month proclaimed that “Cities Have Grown More Diverse, And More Segregated, Since the 90s.” The headlines originate in the key findings of a new, detailed study from the Othering and Belonging Institute (OBI) at UC Berkeley. The study leans heavily on a relatively new metric – the Divergence Index – which has impressed many researchers (myself included) with its versatility. But now that we have seen the Divergence Index in action, its versatility clearly comes at a cost: the Divergence Index conflates what we would intuitively call diversity with “segregation.” As a result, more-diverse metro areas are usually ranked as more segregated by the Divergence Index. And as America became far more diverse over the past 30 years, it is logical that the Divergence Index would rise in most metro areas. Why is it so hard to measure segregation? Racial segregation is easy to see. You walk down the street and almost everybody in one neighborhood looks different than you and almost everybody in another neighborhood looks the same as you. The human eye and ear can also distinguish categories that are meaningful in some contexts but not others. Everybody but me in the café where I watched European soccer last week appeared to be not only Black but specifically Ethiopian. Was that café integrated or segregated? I certainly felt welcome as I bantered at the bar with an Ethiopian-American tennis instructor. But statistically, the café was far more Black and vastly more Ethiopian than the D.C. region as a whole. In this context, “segregation” refers to places where one group is overrepresented – like the café – not to the legal regime that imposed second-class citizenship and pervaded every aspect of life for black Americans. Given the word’s loaded history, it would have been wiser for social […]

Christian Hilber and Andreas Mense argue that the price to rent ratio only increases with a demand shock where supply is sufficiently constrained
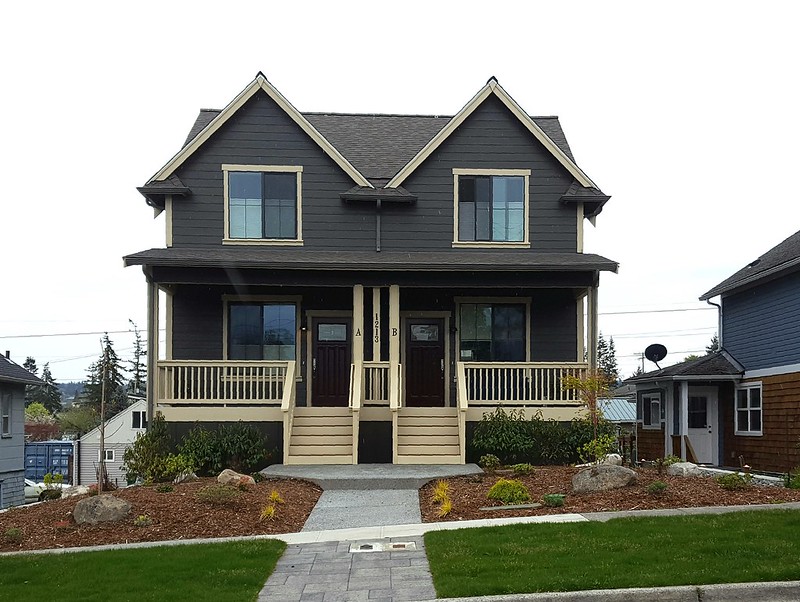
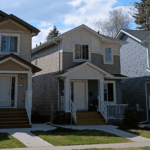
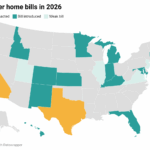
After over a century, Berkeley, California may be about to legalize missing middle housing – and it’s not alone. Bids to re-legalize gradual densification in the form of duplexes, triplexes, fourplexes, and the like have begun to pick up steam over the last several years. In 2019, Oregon legalized these housing types statewide while Minneapolis did the same at the city level. In 2020, Virginia and Maryland both tried to pass similar legislation, though they ultimately failed. This year, though, Montana and California may pick up the torch with their own state bills (even while the cities of Sacramento and South San Francisco consider liberalizing unilaterally alongside Berkeley). Allowing gradual densification is an absolutely necessary step towards general affordability. Supply, demand, and price form an iron triangle–the more responsive we can make supply to demand, the less price will spike to make up the difference.* What I really want to focus on here, though, is less about policy and more about political economy. I believe allowing medium-intensity residential development could make additional reforms easier to achieve and change views around development going into the future. We Love What We Know More often than not, I think a generalized status quo bias explains a lot of NIMBYism. Homeowners are most comfortable with their neighborhoods as they are now and are accustomed to the idea that they have the right to veto any substantial changes. Legalizing forms of incrementally more intense development could re-anchor homeowners on gradual change and development as the norm. The first part of the story is about generational turnover. If the individuals buying homes today–and the cohorts that follow–are exposed to gradually densifying neighborhoods in their day-to-day, they’ll anchor on that as what’s normal and therefore acceptable. Moreover, if we’re debating whether to rezone an area for mid-rise […]
A recent paper by UCLA researchers discusses 2019-20 literature on the relationship between new construction and rents. The article discusses five papers; four of them found that new housing consistently lowers rents in nearby buildings. For example, Kate Pennington wrote a paper on the relationship between new construction and housing costs in San Francisco. What is unique about this paper is that while other papers focus on a broad sample of new construction, Pennington focuses on one subset of the market: “new construction caused by serious building fires.” Why? Because most new construction is in high-demand areas. Any study that focuses on such construction will be more likely to conclude that the new construction is related to high rents, when in fact the real cause of increased rents is increased demand for certain neighborhoods. Pennington found that rents actually decreased within 500 meters of new buildings- by 2.3 percent, compared to similar blocks without new buildings. Pennington also found 17.1 percent less displacement (which she defines as moves to poorer zipcodes) near the new buildings, and found that landlords were less likely to evict rent-controlled tenants. One paper was a partial exception to the pro-supply trend of recent scholarship: a paper by Anthony Damiano and Chris Frenier found that new buildings in Minneapolis lowered rents for most nearby buildings, but increased rents for the cheapest buildings. But the UCLA researches point out that “Damiano and Frenier do not adjust the rents in their study for inflation, which is an unusual decision, and one that makes the rent increases they report look much larger than they actually were.” Adjusted for inflation, rents near new buildings declined by 7 percent overall, and increased by only 0.2 percent for the cheapest buildings. One point that the UCLA researches do not mention: although the […]