Physical Address
304 North Cardinal St.
Dorchester Center, MA 02124
Physical Address
304 North Cardinal St.
Dorchester Center, MA 02124

Liberalizing Cities
From The Ground Up

Via Kevin Lewis, a new paper in an influential econ journal demonstrates that mayoral elections have a large influence on housing supply outcomes. It also shows that developer’s political contributions pay off in ways that sound like corruption. Returns to…

On Twitter, Patrick Collison chided YIMBYs for using Paris as an example of density – because Paris happens to not only be a helpful example of high population density midrise urban form, but is also widely considered the most beautiful…
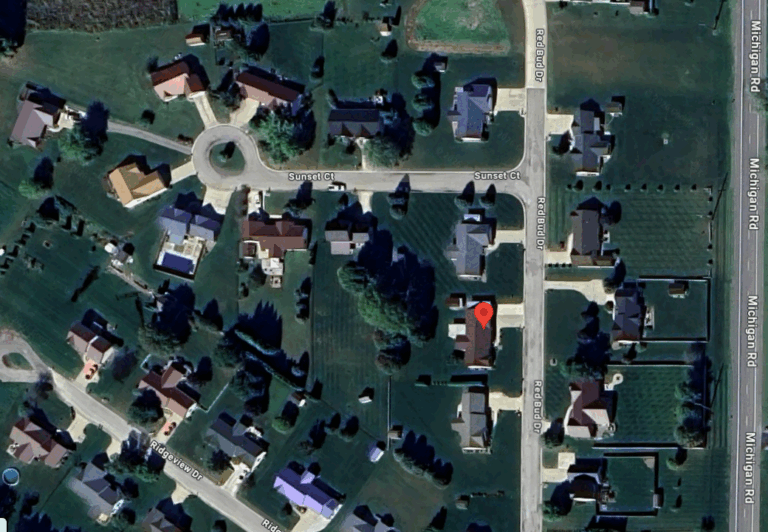
News from the outskirts of a small midwestern town: [Following up on a neighbor’s complaint,] Building Commissioner Dennis Manuwal reviewed the property and confirmed the shed, which sits just two feet from the property line, was in violation of city…
Learn the answer in the Miami Herald and 30 other papers that syndicated my op-ed this week.
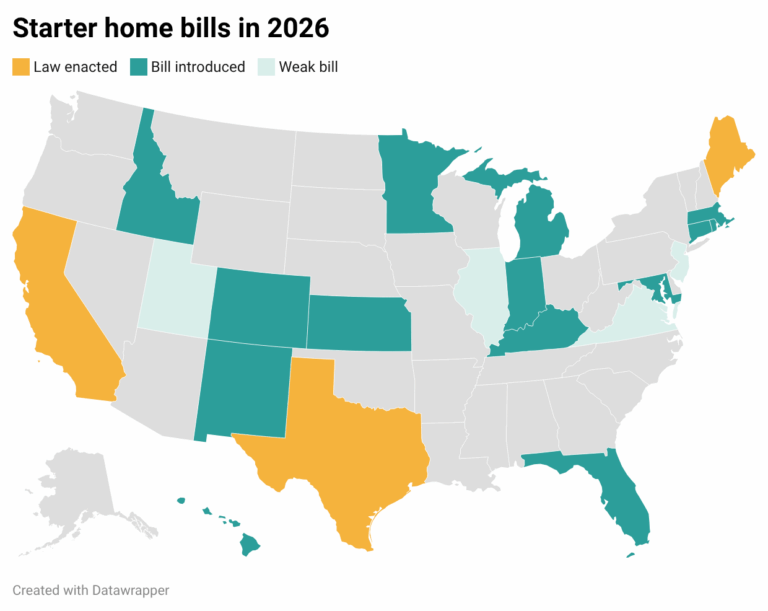
Updated 3/23 to add Minnesota & second Idaho bill, 2/19 to add Michigan, 2/17 to add Kentucky, 2/16 to add Idaho, 2/11 to add Connecticut; 2/5 to add Colorado; and 1/30 to add Hawaii, Kansas, New Mexico, and Rhode Island.…
In the WSJ, Jeff Yass & Steve Moore play the world’s smallest violin for the poor homeowners who are sitting on more than half a million dollars of nominal capital gains and therefore cannot sell. If only that tiny number…
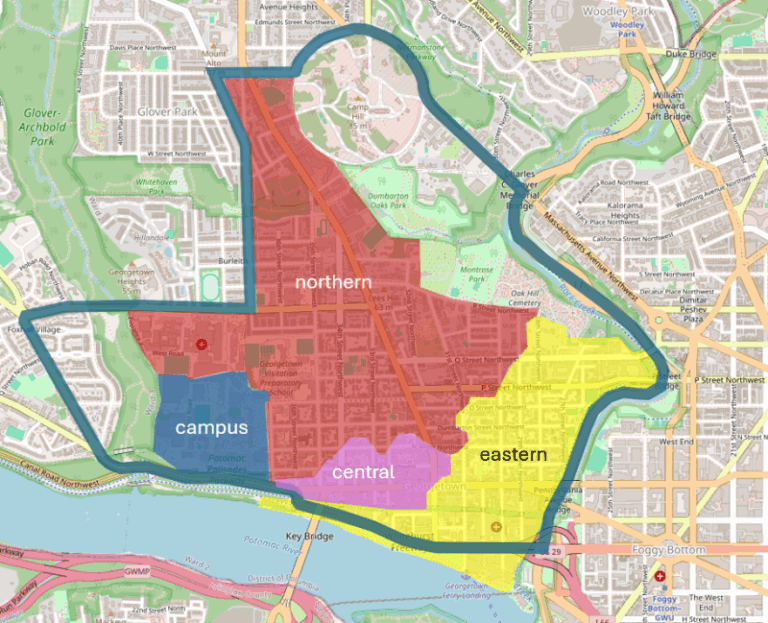
In Greater Greater Washington, my dad and I have a new editorial explaining how a ring-and-access traffic circulation plan inspired by the Netherlands can keep necessary traffic moving while delivering neighborhood streets and iconic shopping streets from traffic. Read the…
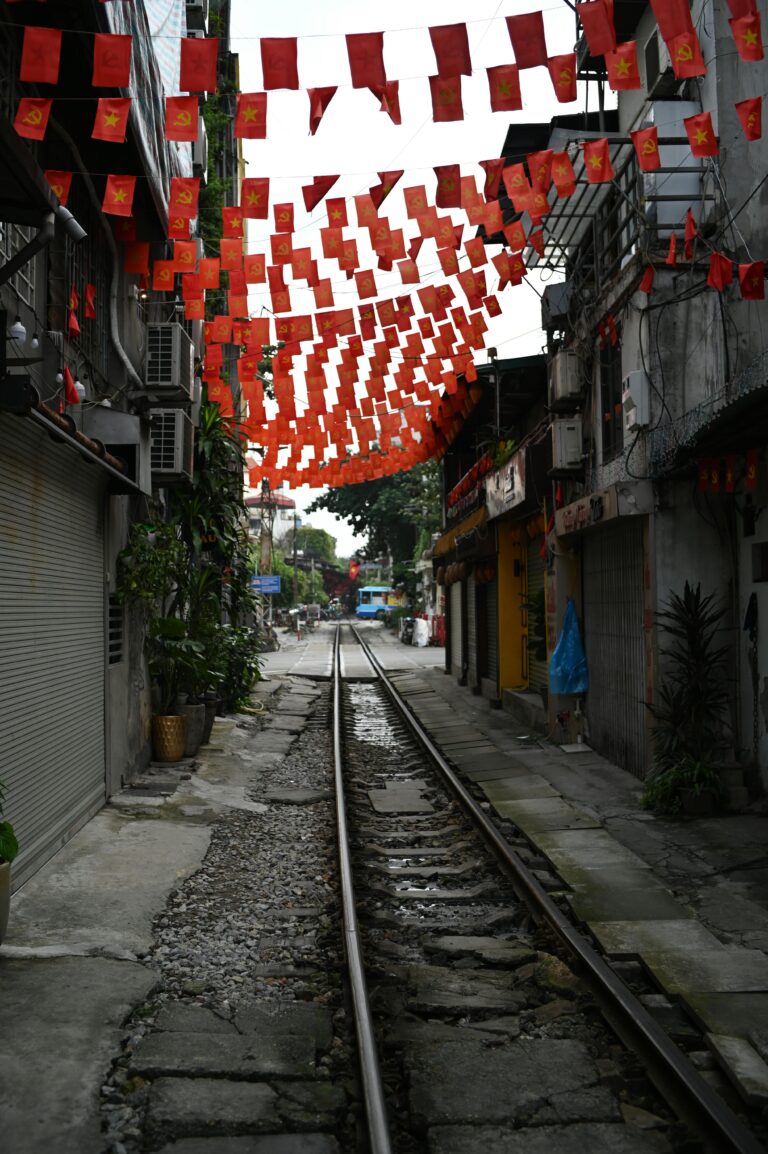
A Vietnamese business paper provides a fascinating window on land prices – official versus market – in an economy that has partially transitioned from socialism to markets: Hanoi has been collecting public feedback on its first-ever land price list, set…
Are rising prices in Kalamazoo a symptom of “climate refugees” moving to the cool, Rust Belt uplands? That’s a hypothesis put forward by a friend who works in the climate-insurance-housing cost nexus. It’s a provocative hypothesis. How else can one…
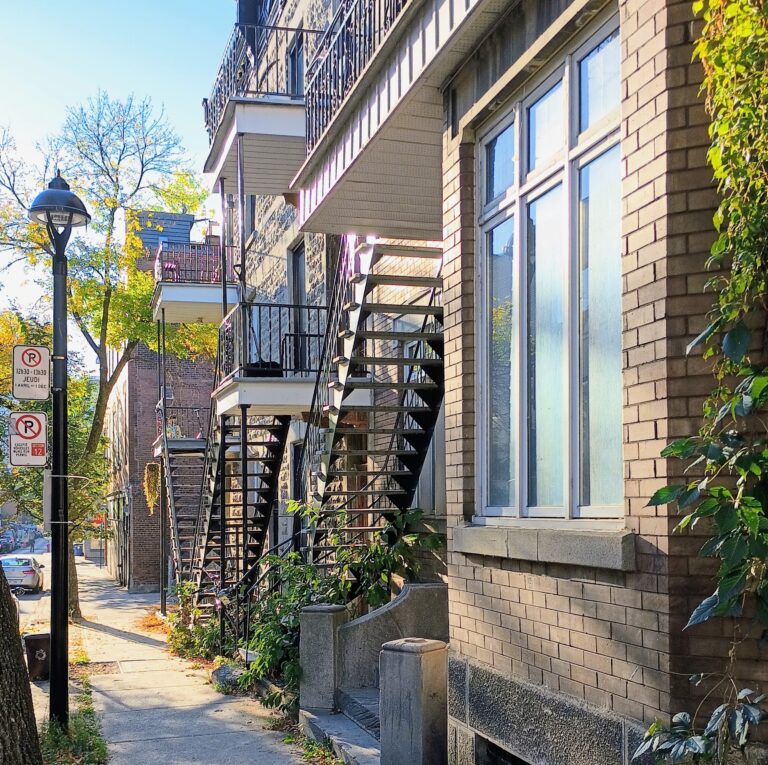
I frequently reference my post summarizing the interesting research at last year’s Urban Economics Association conference. This year was as insight rich as ever. And the Montreal setting was truly special – it’s a city that’s as European as any…