Physical Address
304 North Cardinal St.
Dorchester Center, MA 02124
Physical Address
304 North Cardinal St.
Dorchester Center, MA 02124

Liberalizing Cities
From The Ground Up
On June 23, Congress passed its first big, standalone housing policy bill in a generation. The bill, the 21st Century ROAD to Housing Act, is a salad of small reforms and previously-introduced bills. One of those is the Build Now Act, Section 213 of the law that passed. It underwent several amendments in the legislative process.
The Build Now Act uses an existing stream of federal funding for larger local governments, Community Development Block Grants, to reward localities that improve their net housing growth rate over the course of a decade, and penalize those that worsen their growth rate. The amounts of money in play are modest: the median grant is less than $1 million per year, and the penalty is 10%.
A big part of the legislative process for the Build Now Act was to exempt most places from eligibility, which means they can neither gain nor lose funding.
Throughout the legislative debate over Build Now, I maintained a dataset that helped me loosely estimate how the law might work in practice. My data are not perfect and have some known errors. And, of course, they are backward-looking. Build Now will not take effect until FY 2029, I believe, at which point the evaluation decade will have flipped and the map of disasters will have shifted.
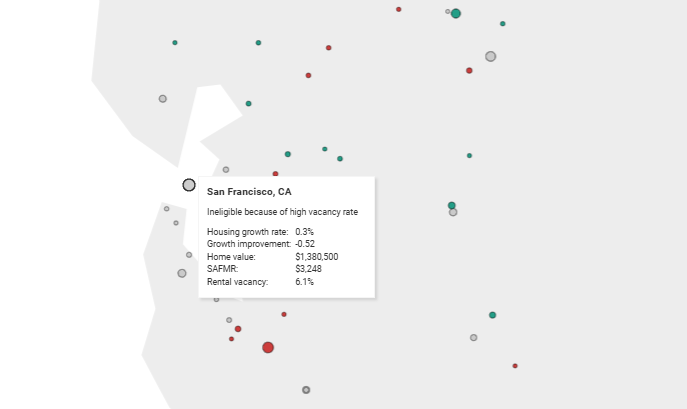
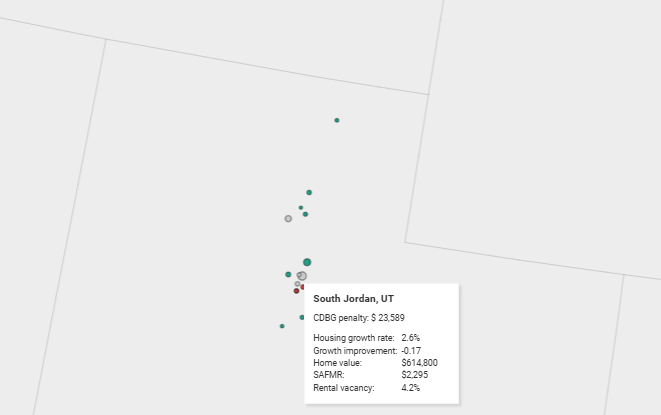
In the map embedded below (and hosted by Datawrapper here), I show which Entitlement Communities would be ineligible and which would gain or lose funding based on the data I have available. NOTE: The amount of data seems to be straining the Datawrapper server. Reload this page several times and eventually the data will show up.

The tooltips show each community’s key stats, including reasons for ineligibility or funding gain/loss. Here’s the Bay Area, where high rental vacancy rates (i.e. lots of short-term rentals for business travelers) make most municipalities ineligible:
And here’s detail from Utah, where South Jordan would lose funding despite having the 25th-highest housing growth in the country from 2020-2024, because its housing growth rate from 2015-2020 was even higher, so it has worsened its performance.
Don’t take this map so much as an indication of which places will actually gain or lose funding when the law comes into effect. Rather, it’s an indication of what a typical year might look like. The biggest takeaway is that most places are ineligible. The second takeaway should be that the law ought to be amended to better match what proponents say it’s meant to do: provide more federal funding to support places that are growing, even if those are in cheaper parts of the country or experienced a nasty snowstorm 2 years ago.
UPDATE: What would I do instead?
If you think the Build Now Act is unnecessarily complicated and poorly targeted to support or incentivize housing production, then you’re right. How can it be fixed? One way, which I & others proposed several years ago, is to build a complex but capable formula.
The other way, which I’ve come around to, is brutally simple:
More homes, more funding. Any politician can explain that to his constituents.


The line doing the most work here is the admission that the data is backward-looking and carries known errors, and the San Francisco case shows what that costs: a rental vacancy rate inflated by short-term rentals flips a whole city out of eligibility. We hit the same wall from the construction side. Counting one thing twice because two places copied each other corrupts every number downstream of it, so we drop duplicates rather than count them, and anything we publish carries the date it was confirmed and how well corroborated it is. That is written up as what it takes to confirm a construction finding before we publish it. Publishing the uncertainty the way you have with the map caveats is the honest version, and it is rarer than it ought to be.